Hardy-Weinberg Equilibrium Calculator
Effortlessly calculate allele and genotype frequencies with our intuitive Hardy-Weinberg Equilibrium Calculator (Also known as Allele Frequency Calculator). Whether you’re a student, researcher, or genetics enthusiast, this tool makes exploring genetic diversity and evolutionary dynamics faster, easier, and more accurate than ever. Dive into the science of inheritance—start your calculation now!
Results
All About Hardy-Weinberg Equilibrium and Its Calculator
The Hardy Weinberg Equilibrium Calculator is a cutting-edge, web-based tool that demystifies the complexities of population genetics. Designed to facilitate seamless exploration of allele frequencies and genotype frequencies, this calculator is indispensable for anyone looking to understand the genetic composition of populations. It combines powerful mathematical models with an intuitive interface to provide essential insights into how genes are distributed and inherited across generations.
To fully appreciate the value of this tool, it’s essential to grasp the foundational concept it is built upon: Hardy-Weinberg Equilibrium (HWE).
What is Hardy-Weinberg Equilibrium?
Proposed in 1908 by G.H. Hardy and Wilhelm Weinberg, the Hardy-Weinberg principle forms the cornerstone of population genetics. It predicts how gene variants, or alleles, are distributed in a population under ideal conditions. The principle serves as a null model for genetic studies, allowing researchers to determine if evolutionary forces like selection, mutation, or migration are at play.
Core Features of Hardy-Weinberg Equilibrium
Applicability to Diploid Organisms
- HWE applies specifically to organisms with two sets of chromosomes (diploid), ensuring that every genetic trait is represented by two alleles—one from each parent.
Relationship Between Allele and Genotype Frequencies
- Allele Frequency: The proportion of specific alleles (e.g., A or a) in a population’s gene pool.
- Genotype Frequency: The proportion of individuals with specific combinations of alleles (e.g., AA, Aa, aa).
Under HWE, the relationship is mathematically defined as:
p2+2pq+q2=1p^2 + 2pq + q^2 = 1
Where:
- pp: Frequency of the dominant allele (A).
- qq: Frequency of the recessive allele (a).
- p2p^2: Frequency of the homozygous dominant genotype (AA).
- 2pq2pq: Frequency of the heterozygous genotype (Aa).
- q2q^2: Frequency of the homozygous recessive genotype (aa).
Idealized Conditions
For a population to adhere to HWE, certain conditions must be met:- Large population size to eliminate genetic drift.
- Random mating with no preference for specific traits.
- No mutation altering allele frequencies.
- No migration into or out of the population.
- No selection favoring one genotype over another.
Benchmark for Evolutionary Analysis
Deviations from HWE indicate the influence of evolutionary forces like natural selection, genetic drift, gene flow, or mutations, offering insights into population dynamics.
Why Use the Hardy-Weinberg Equilibrium Calculator?
The Hardy-Weinberg Equilibrium Calculator bridges the gap between theory and application, enabling users to quickly compute allele and genotype frequencies. By simplifying complex genetic equations, the tool is ideal for:
- Identifying deviations from HWE to uncover evolutionary changes.
- Visualizing the genetic structure of populations for better comprehension.
- Supporting academic research, genetic counseling, conservation biology, and more.
This tool ensures a user-friendly experience while maintaining scientific rigor, making it perfect for students, educators, researchers, and professionals alike.
Whether you’re new to genetics or a seasoned researcher, the Hardy-Weinberg Equilibrium Calculator offers a comprehensive platform to deepen your understanding of population genetics and the forces shaping genetic variation.
How to Use This Allele Frequency Calculator
Using the Hardy-Weinberg Equilibrium Calculator is intuitive and straightforward. This step-by-step guide ensures you make the most of the tool’s powerful features, whether you’re calculating allele frequencies, genotype frequencies, or exploring population dynamics.
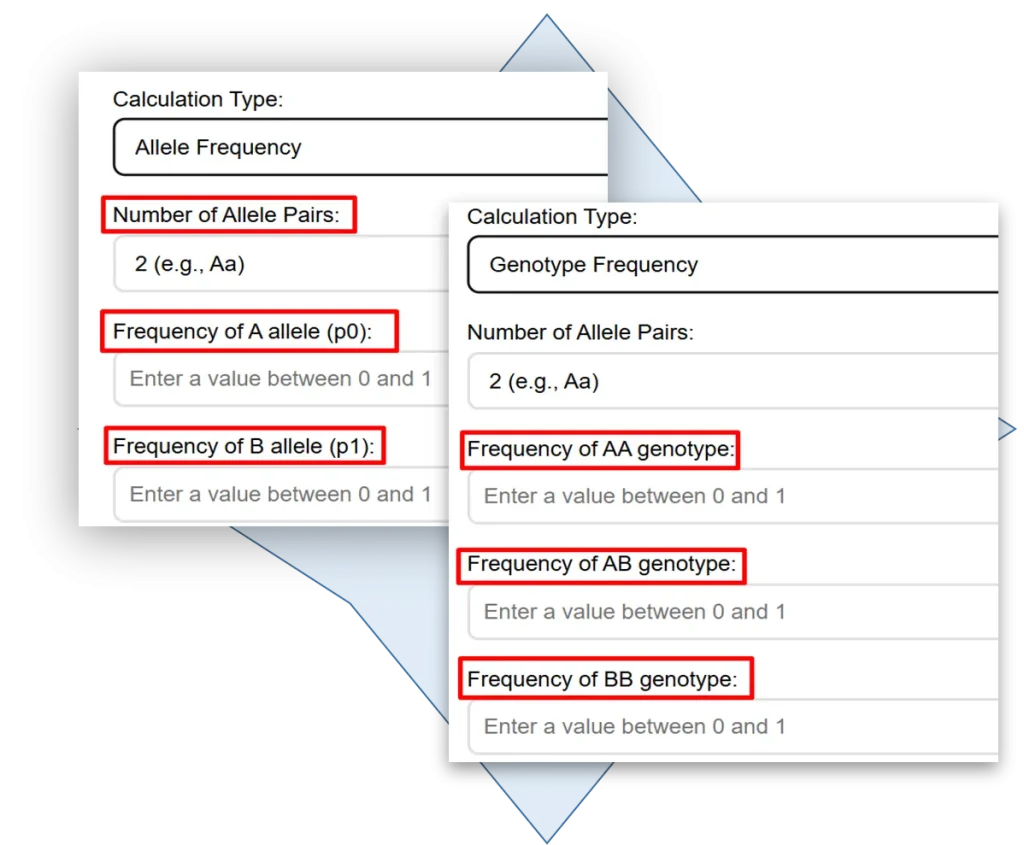
Step 1: Select Your Calculation Type
Begin by choosing the type of calculation you need:
- Allele Frequency: Use this mode if you have allele frequencies (e.g., p and q) and want to calculate the expected distribution of genotypes (AA, Aa, aa).
- Genotype Frequency: Use this mode if you know the frequencies of genotypes and need to derive allele frequencies.
💡 Tip: Select the option that aligns with the data you already have or the insights you’re looking to gain.
Step 2: Set the Number of Allele Pairs
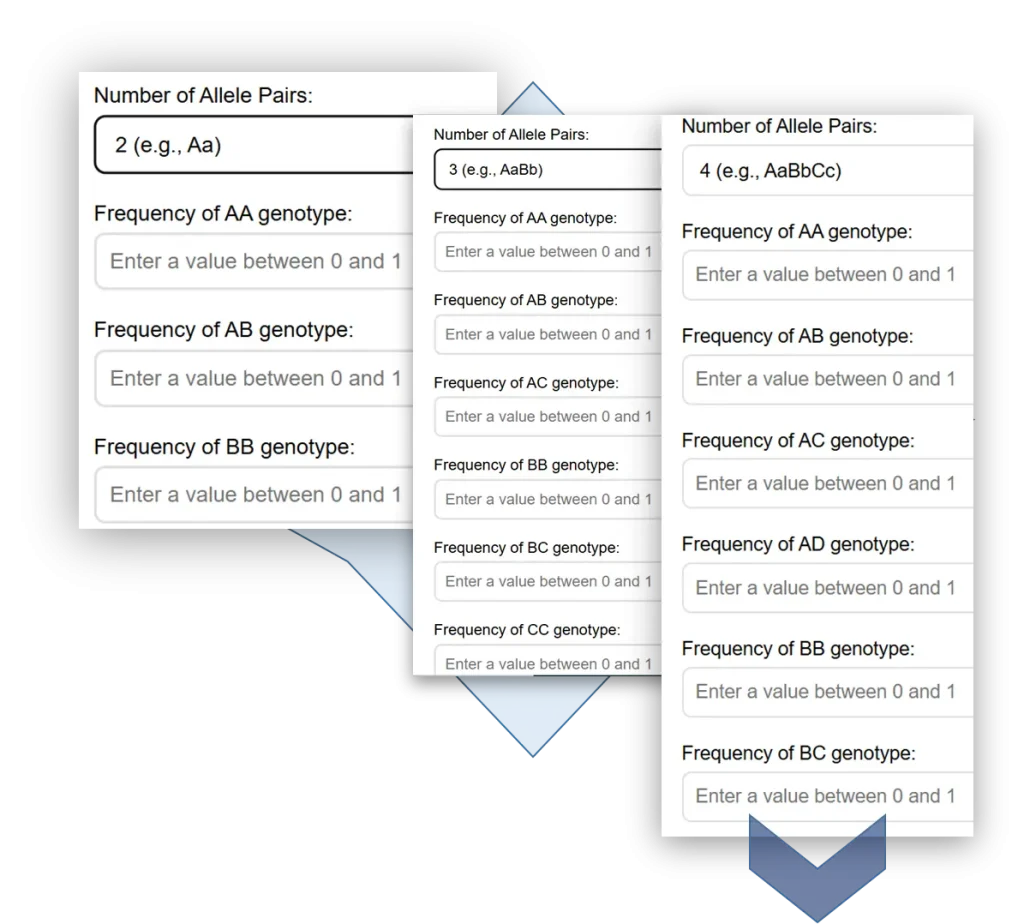
Specify the number of alleles involved in your calculation. This tool supports upto 4 allele pairs from users.
- Choose 2 alleles for a single-gene system (e.g., A/a).
- Opt for 3 or 4 alleles if dealing with more complex genetic scenarios.
💡 Tip: For most basic genetics problems, selecting 2 alleles is sufficient. Use higher allele counts for multiallelic traits or loci.
Step 3: Enter Known Frequencies
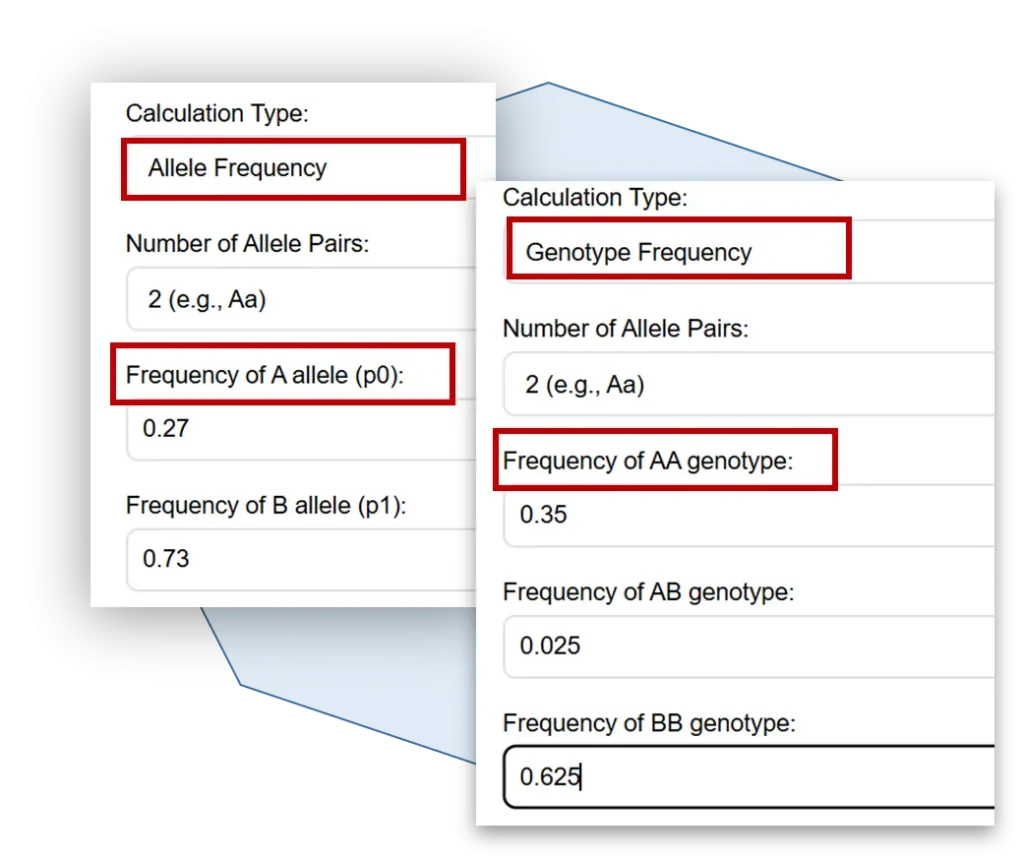
Input the values for the frequencies you have:
- Allele Frequencies: Provide the proportion of dominant and recessive alleles in the population. For example, p=0.6p = 0.6p=0.6, q=0.4q = 0.4q=0.4.
- Genotype Frequencies: Enter proportions for AA, Aa, and aa (or others if multiallelic).
Note that only one of the above is needed as selected in the first step.
💡 Tip: Ensure the sum of allele frequencies equals 1 (p+q=1p + q = 1p+q=1) or that genotype frequencies total 1 (p2+2pq+q2=1p^2 + 2pq + q^2 = 1p2+2pq+q2=1) for valid calculations.
Step 4: Add Optional Parameters and Run The Calculation
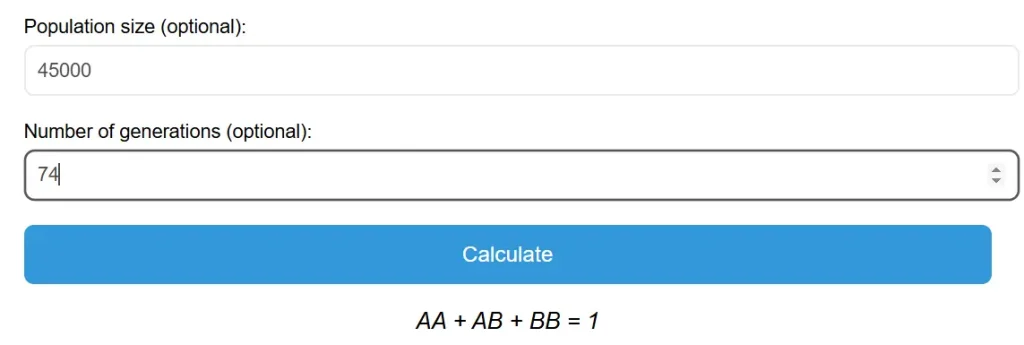
Enhance your analysis by including these optional settings:
- Population Size: Specify the total number of individuals to scale your results.
- Number of Generations: Analyze how frequencies evolve over time by entering the number of generations.
💡 Tip: These parameters are especially useful for studies in genetic drift, small populations, or evolutionary dynamics.
Once you have input all the necessary and optional details, you are good to go and click the “Calculate” button to execute the calculation. The tool processes your inputs instantly, applying the Hardy-Weinberg equations to generate results.
Step 5: Review and Interpret the Results
The calculator presents two key outputs for easy understanding:
- Numerical Results: Displays allele and genotype frequencies in clear tabular form.
- Visual Representation: Generates bar charts or graphs to help you visualize the distribution of genetic traits.
Key Insights You Can Draw:
- Equilibrium Status: Determine whether the population adheres to Hardy-Weinberg equilibrium.
- Carrier and Affected Rates: Identify proportions of carriers (e.g., Aa) or affected individuals (e.g., aa) in genetic studies.
- Frequency Evolution: Observe changes over generations (if optional parameters were included).

An Example Illustration of Allele Frequency Calculation:
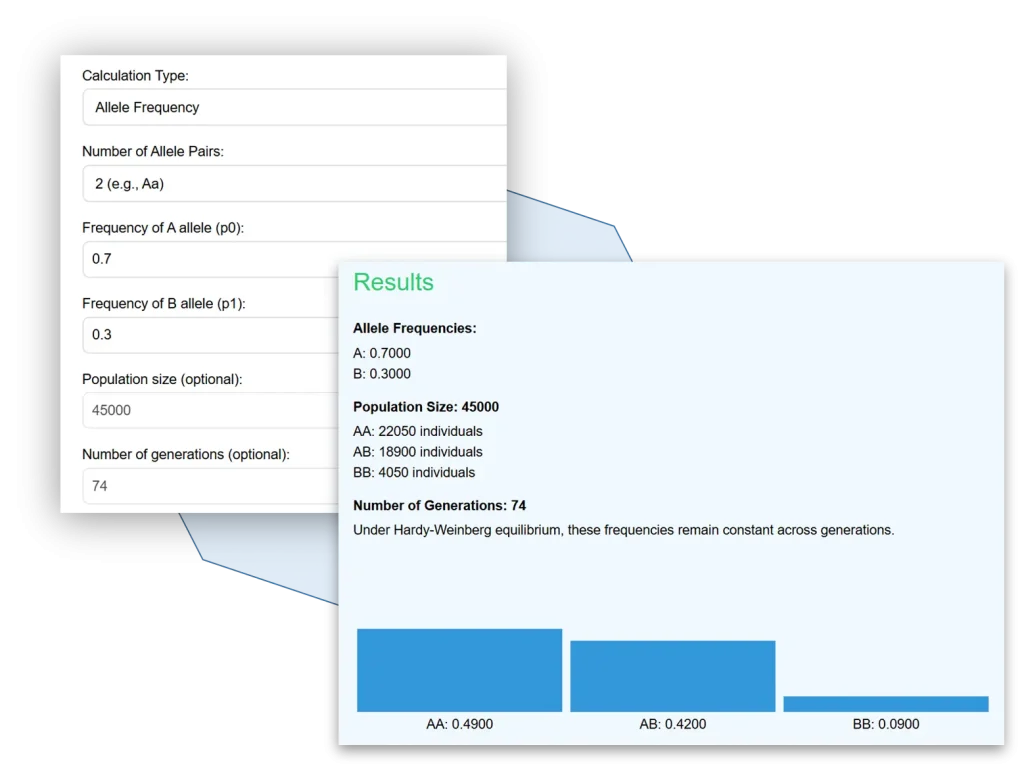
Suppose we have p=0.7 and q=0.3. Then we will choose the “Allele Frequency” in the first step, and enter the inputs in the second step. Also, we have 45000 population and 74 generations, the resulf of this would be as show in the image to the right.
Features of this HWE Calculator
The Hardy-Weinberg Equilibrium Calculator is designed with powerful and user-friendly features to cater to a wide range of users, including students, educators, researchers, and professionals. These features ensure that complex population genetics calculations are both accessible and insightful.
1. Dual Calculation Modes
The calculator supports two primary calculation types to address different needs:
- Allele Frequency to Genotype Frequency: Enter allele frequencies (ppp and qqq) to calculate the expected genotype frequencies (p2,2pq,q2p^2, 2pq, q^2p2,2pq,q2).
- Genotype Frequency to Allele Frequency: Input genotype frequencies to derive the corresponding allele frequencies.
💡 Benefit: These modes allow for flexible analysis depending on the available data and the question being addressed.
2. Support for Multiple Allele Pairs
Analyze genetic scenarios involving up to four allele pairs, enabling calculations for more complex traits and multiallelic systems.
- 2 Alleles: Ideal for simple Mendelian inheritance (e.g., A/a).
- 3 or 4 Alleles: For multiallelic systems or polygenic traits.
💡 Benefit: Extend your analysis beyond basic genetics to explore traits with more diverse genetic contributions.
3. Advanced Options for Enhanced Analysis
Expand the scope of your calculations with additional parameters:
- Population Size: Scale your results to reflect real-world population sizes.
- Number of Generations: Simulate evolutionary trends and predict how allele and genotype frequencies change over time.
💡 Benefit: Tailor calculations to your specific research or study objectives for a more detailed understanding of population dynamics.
4. Visual Outputs for Better Understanding
The calculator includes built-in tools for data visualization:
- Bar Charts: Display genotype distributions in an easy-to-understand format.
- Color-Coded Graphs: Enhance interpretation and presentation of results.
💡 Benefit: Transform numerical data into clear, impactful visuals for reports, presentations, or classroom discussions.
Real-Life Applications of this Allele Frequency Calculator
The Allele Frequency Calculator is more than just a computational tool—it’s a practical resource with broad applications across multiple fields. By simplifying complex genetic analyses, this calculator enables users to make informed decisions, test hypotheses, and explore genetic trends in real-world scenarios.
1. Predicting Blood Type Distribution
Application: Blood banks and healthcare organizations use genetic data to predict the distribution of blood types in populations.
- Scenario: Suppose allele frequencies for blood type A and O are p=0.6p = 0.6p=0.6 and q=0.4q = 0.4q=0.4, respectively.
- Using the Calculator: Input these allele frequencies to calculate genotype frequencies for AA, AO, and OO.
- Outcome: Insights into the prevalence of each blood type can optimize blood donation drives and inventory management.
💡 Relevance: This application ensures a reliable blood supply tailored to population needs.
2. Assessing Genetic Disorder Risks
Application: Genetic counselors and medical professionals estimate carrier and affected frequencies for genetic disorders like cystic fibrosis or sickle cell anemia.
- Scenario: The cystic fibrosis allele frequency in a population is q=0.02q = 0.02q=0.02.
- Using the Calculator:
- Calculate genotype frequencies:
- Normal homozygous (FFFFFF): p2p^2p2.
- Carriers (FfFfFf): 2pq2pq2pq.
- Affected individuals (ffffff): q2q^2q2.
- Calculate genotype frequencies:
- Outcome: Identify the percentage of carriers in the population, aiding in family planning and risk assessment.
💡 Relevance: This information helps predict disorder prevalence and guides preventative healthcare strategies.
3. Supporting Wildlife Conservation
Application: Conservation biologists assess genetic diversity in endangered species populations to develop strategies that mitigate risks associated with inbreeding and population bottlenecks.
- Scenario: An isolated population of 500 animals has a recessive allele frequency (q=0.1q = 0.1q=0.1).
- Using the Calculator:
- Calculate the proportion of homozygous recessive individuals and heterozygotes.
- Simulate genetic changes over generations with small population sizes.
- Outcome: Develop conservation programs that promote genetic diversity and long-term population survival.
💡 Relevance: This ensures the maintenance of healthy, viable populations in the wild.
4. Enhancing Agricultural Genetics
Application: Plant and animal breeders use genetic insights to improve traits such as yield, disease resistance, and productivity in crops or livestock.
- Scenario: In a cattle breeding program, the frequency of a dominant allele for high milk production is p=0.75p = 0.75p=0.75.
- Using the Calculator:
- Predict genotype distributions to estimate the proportion of high-yield cattle.
- Analyze the impact of selective breeding over generations.
- Outcome: Refine breeding programs to achieve desired traits efficiently.
💡 Relevance: These insights optimize breeding strategies, improving agricultural outputs sustainably.
The Science Behnind HWE Calculator
The Allele Frequency Calculator is grounded in the principles of population genetics, leveraging precise mathematical equations and biological assumptions to deliver accurate insights. This section delves into the science behind the tool, explaining the key equations and the foundational assumptions required for Hardy-Weinberg equilibrium (HWE) to hold true.
Key Equations Related to HWE:
The calculator is built on the mathematical framework of the Hardy-Weinberg principle, which predicts genetic variation in populations under ideal conditions.
Basic Model for Two Alleles (A and a)
-
Allele Frequency Relationship
The sum of the frequencies of the two alleles (A and a) in a population equals 1:p+q=1p + q = 1
Where:
- pp: Frequency of the dominant allele (A).
- qq: Frequency of the recessive allele (a).
-
Genotype Frequency Predictions
The distribution of genotypes in the population can be derived from the allele frequencies:- Homozygous dominant (AAAA): p2p^2
- Heterozygous (AaAa): 2pq2pq
- Homozygous recessive (aaaa): q2q^2
The total genotype frequencies add up to 1:
p2+2pq+q2=1p^2 + 2pq + q^2 = 1
Extended Model for Multiple Allele Pairs
For more complex scenarios involving two gene pairs (A/a and B/b), the Hardy-Weinberg principle extends as:
(p+q)2×(r+s)2=1(p + q)^2 \times (r + s)^2 = 1
Where:
- p,qp, q: Frequencies of the two alleles for the first gene pair (A and a).
- r,sr, s: Frequencies of the two alleles for the second gene pair (B and b).

Assumptions of Hardy Weinberg Equilibrium
The Hardy-Weinberg principle rests on several key assumptions that describe an idealized population. When these conditions are met, allele and genotype frequencies remain constant across generations.
1. Infinite Population Size
- Large population size minimizes the impact of genetic drift, which causes random fluctuations in allele frequencies.
Implication: Small populations are more likely to deviate from equilibrium due to random chance.
2. Random Mating
- Mating occurs without regard to genetic traits, ensuring all individuals have equal opportunities to reproduce.
Implication: Assortative mating or inbreeding can disrupt equilibrium.
3. No Mutation
- No new alleles are introduced, and existing alleles do not mutate into others.
Implication: Mutation introduces genetic variation, driving populations away from equilibrium.
4. No Gene Flow
- No migration into or out of the population occurs, preventing the introduction or removal of alleles.
Implication: Populations exchanging alleles with others experience changes in allele frequencies.
5. No Selection
- All genotypes have equal reproductive success, with no selective advantage for any trait.
Implication: Natural selection alters allele frequencies by favoring some traits over others.
6. Non-Overlapping Generations
- Generations are discrete, and there is no overlap between parents and offspring in reproductive activity.
Implication: Overlapping generations can complicate the calculation of allele and genotype frequencies.
