What Is Incomplete Dominance?
Incomplete dominance is an inheritance pattern where the heterozygous genotype has a phenotype between the two homozygous phenotypes. Neither allele fully hides the other. The result is not a dominant look and not a recessive look. It is an intermediate trait.
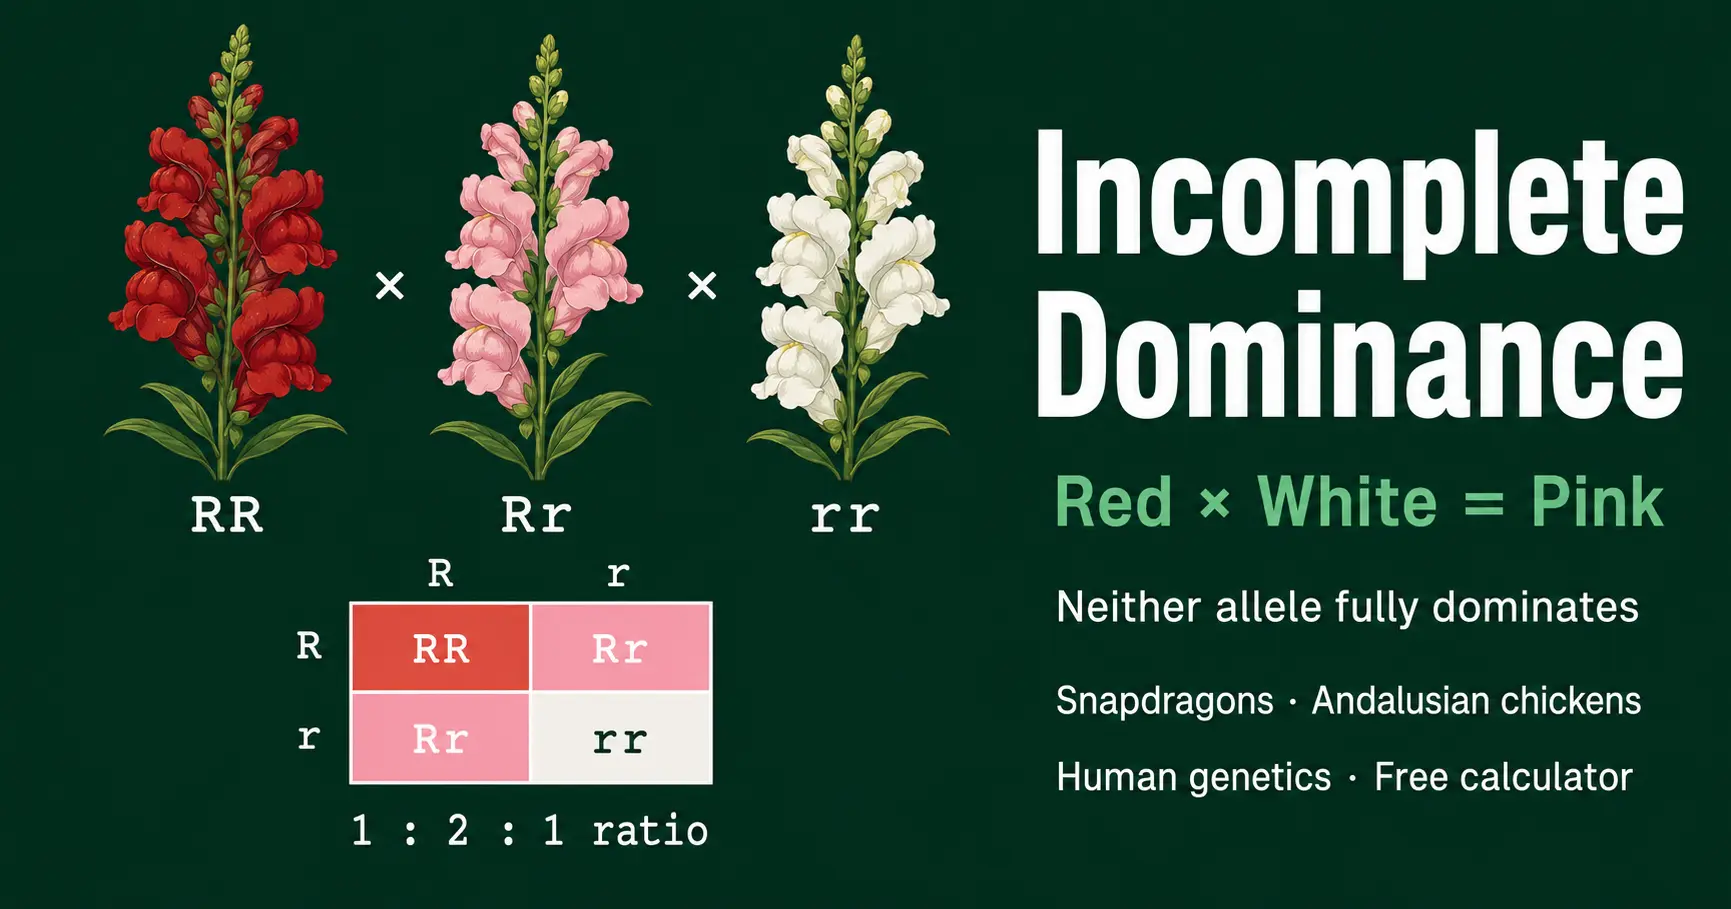
A red snapdragon with genotype RR produces strong red pigment. A white snapdragon with genotype rr produces little or no red pigment. A pink snapdragon with genotype Rr has one functional allele, so pigment production is lower than RR but higher than rr.
| Genotype | Genetic state | Allele expression | Phenotype example |
|---|---|---|---|
| RR | Homozygous dominant | Full pigment or full trait expression | Red snapdragon flower |
| Rr | Heterozygous | Partial expression from one functional allele | Pink snapdragon flower |
| rr | Homozygous recessive | Little or no pigment from this gene | White snapdragon flower |
How to Solve an Incomplete Dominance Punnett Square
- 1Write the parent genotypes: Use two alleles for one gene. For snapdragons, RR is red, Rr is pink, and rr is white.
- 2Separate each parent into gametes: A homozygous RR parent makes only R gametes. A heterozygous Rr parent makes R and r gametes.
- 3Fill the Punnett square: Place one parent across the top and one parent down the side. Combine one allele from each parent in every box.
- 4Translate genotypes into phenotypes: Count RR, Rr, and rr. In incomplete dominance, Rr gets its own phenotype, so Rr is not grouped with RR.
Incomplete Dominance Examples and Practice Worksheets
Use these practice worksheet questions after the calculator. Try each cross first, then open the answer. The most common exam clue is a 1:2:1 phenotype ratio in the offspring.
Worksheet 1: Red snapdragon crossed with white snapdragon
Question: A red snapdragon has genotype RR. A white snapdragon has genotype rr. What genotypes and phenotypes appear in the offspring?
Answer: All offspring are Rr. The phenotype is 100% pink because the heterozygote shows the intermediate flower colour.
Genotype ratio: 100% Rr. Phenotype ratio: 100% pink.
Worksheet 2: Pink snapdragon crossed with pink snapdragon
Question: Two pink snapdragons are crossed. Both parents are Rr. Predict the offspring.
Answer: The Punnett square gives RR, Rr, Rr, and rr. The offspring are 25% red, 50% pink, and 25% white.
Genotype ratio: 1 RR : 2 Rr : 1 rr. Phenotype ratio: 1 red : 2 pink : 1 white.
Worksheet 3: Pink snapdragon crossed with white snapdragon
Question: A pink snapdragon is crossed with a white snapdragon. The genotypes are Rr and rr. What is the expected result?
Answer: The pink parent makes R and r gametes. The white parent makes only r gametes. The offspring are 50% Rr and 50% rr.
Phenotype ratio: 1 pink : 1 white.
Worksheet 4: Andalusian chicken feather colour
Question: In Andalusian chickens, BB is black, Bb is blue, and bb is white. What happens when two blue chickens are crossed?
Answer: A Bb by Bb cross gives BB, Bb, Bb, and bb. The expected offspring are 25% black, 50% blue, and 25% white.
Phenotype ratio: 1 black : 2 blue : 1 white.
Worksheet 5: Identify the inheritance pattern
Question: A black animal crossed with a white animal produces grey offspring. When two grey offspring are crossed, black, grey, and white appear in a 1:2:1 ratio. What pattern is this?
Answer: This is incomplete dominance. The grey heterozygote is intermediate between the two homozygous phenotypes.
Key clue: the heterozygote has a blended phenotype.
Worked Punnett Square Examples
Red snapdragon by white snapdragon
The cross is RR by rr. The red parent gives R. The white parent gives r. Every offspring is Rr.
Pink snapdragon by pink snapdragon
The cross is Rr by Rr. Each parent gives R or r. The offspring cells are RR, Rr, Rr, and rr.
Codominance Punnett Square: Quick Guide
Students often compare incomplete dominance with codominance. The grid setup is the same, but the heterozygote meaning changes. Incomplete dominance blends the trait. Codominance shows both traits together. You can model codominance in more detail with the Codominance Calculator or practice ABO outcomes with the Blood Type Calculator.
What is a codominance Punnett square?
It is a normal Punnett square used for a trait where both alleles are visible in the heterozygote. The grid predicts genotypes first. You then label the heterozygote as showing both traits.
How do you make a codominance Punnett square?
Write each parent genotype, split each genotype into gametes, place gametes on the top and side, fill the boxes, then count the outcomes. Use allele symbols that keep both alleles visible, such as IA and IB for ABO blood type.
How do you solve a codominance Punnett square?
Solve the grid the same way as any monohybrid cross. The difference is interpretation. IAIB is not a blend of A and B. It is blood type AB because both antigens are expressed.
What does a codominance Punnett square look like?
It looks like a 2 by 2 grid for one gene. Some boxes may contain a heterozygous genotype such as IAIB, CRCW, or RW. Those boxes represent both traits together.
How do you show codominance in a Punnett square?
Show codominance by naming the heterozygous phenotype as both traits, not as an average. For example, CRW can be red and white hairs together, while Rr in incomplete dominance may be pink.
How does a dihybrid codominance Punnett square work?
A dihybrid codominance Punnett square tracks two genes at once. Each heterozygous parent can make four gamete types, so the grid often has 16 boxes. For larger or mixed patterns, a forked line method is usually easier.
For a two trait problem, compare the grid size with a standard dihybrid cross probability calculator. A dihybrid codominance Punnett square can become large, so students should list gametes carefully before filling the 16 boxes.
Incomplete Dominance vs Complete Dominance vs Codominance
| Feature | Complete dominance | Incomplete dominance | Codominance |
|---|---|---|---|
| Heterozygote phenotype | Looks dominant | Intermediate blend | Both traits appear |
| Typical monohybrid phenotype ratio | 3:1 | 1:2:1 | 1:2:1 |
| Can Aa be identified by phenotype? | Usually no | Yes | Yes |
| Common example | Pea flower colour | Snapdragon flower colour | AB blood type |
| Best wording | One allele masks another | Neither allele fully masks the other | Both alleles are expressed |
Common Mistakes in Incomplete Dominance Problems
Grouping Rr with RR
Do not group the heterozygote with the dominant homozygote. Rr has a separate blended phenotype.
Using a 3:1 ratio
A 3:1 phenotype ratio fits complete dominance. Incomplete dominance usually shows 1:2:1 for Rr by Rr.
Calling the blend codominance
A pink flower is not showing red and white separately. It is an intermediate phenotype, so it is incomplete dominance.
Related Tools
Codominance Calculator
Compare incomplete dominance with traits where both alleles appear together.
Open CalculatorDihybrid Cross Probability
Practice two trait crosses and 4 by 4 Punnett square probability.
Open CalculatorMendelian Ratio Chi Square
Test whether observed offspring numbers fit an expected genetic ratio.
Open Calculator