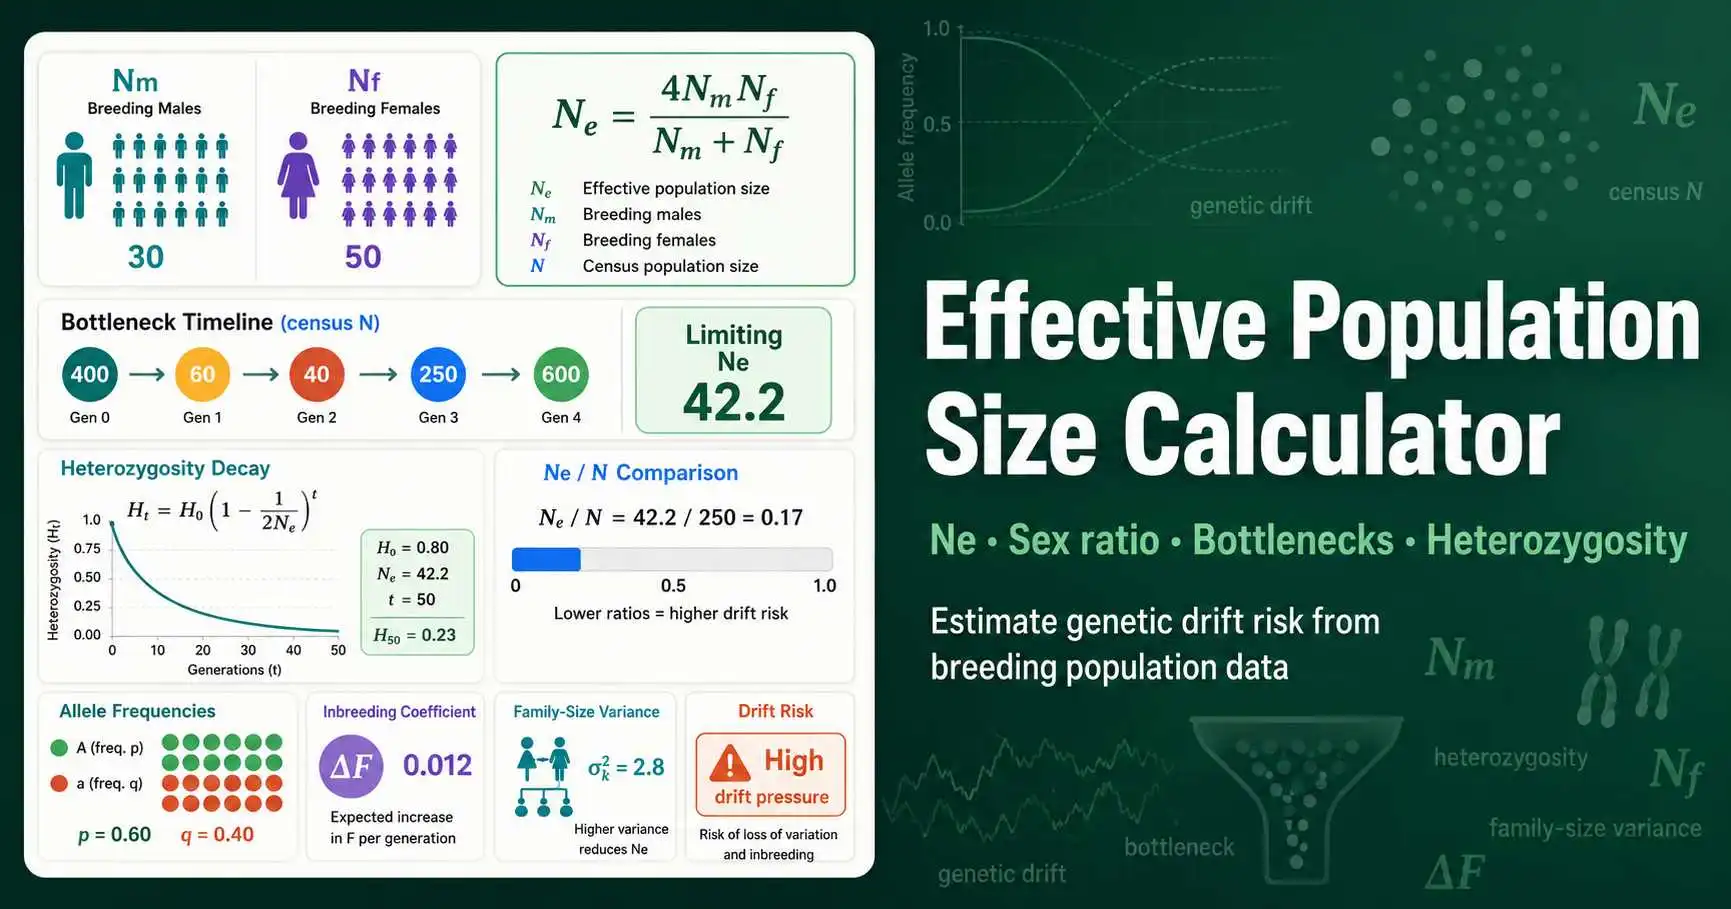
The preset buttons load common biological scenarios. A balanced population demonstrates the ideal case, while the skewed sex-ratio preset shows how a few breeding males can reduce genetic size.
The sex-ratio card calculates Ne from breeding males and breeding females. This section answers the common question, “Why does the genetic size shrink when one sex is rare?”
The family-size variance card estimates how unequal reproductive success changes effective size. Use it when one adult pair, founder line, or brood contributes more descendants than others.
The bottleneck input accepts a comma-separated time series. The output uses the harmonic mean, which gives strong weight to the smallest generation in the history.
The result banner highlights the limiting Ne, Ne/N, inbreeding rate, and heterozygosity retained. The chart then turns those values into a visible diversity trajectory.