Genetics
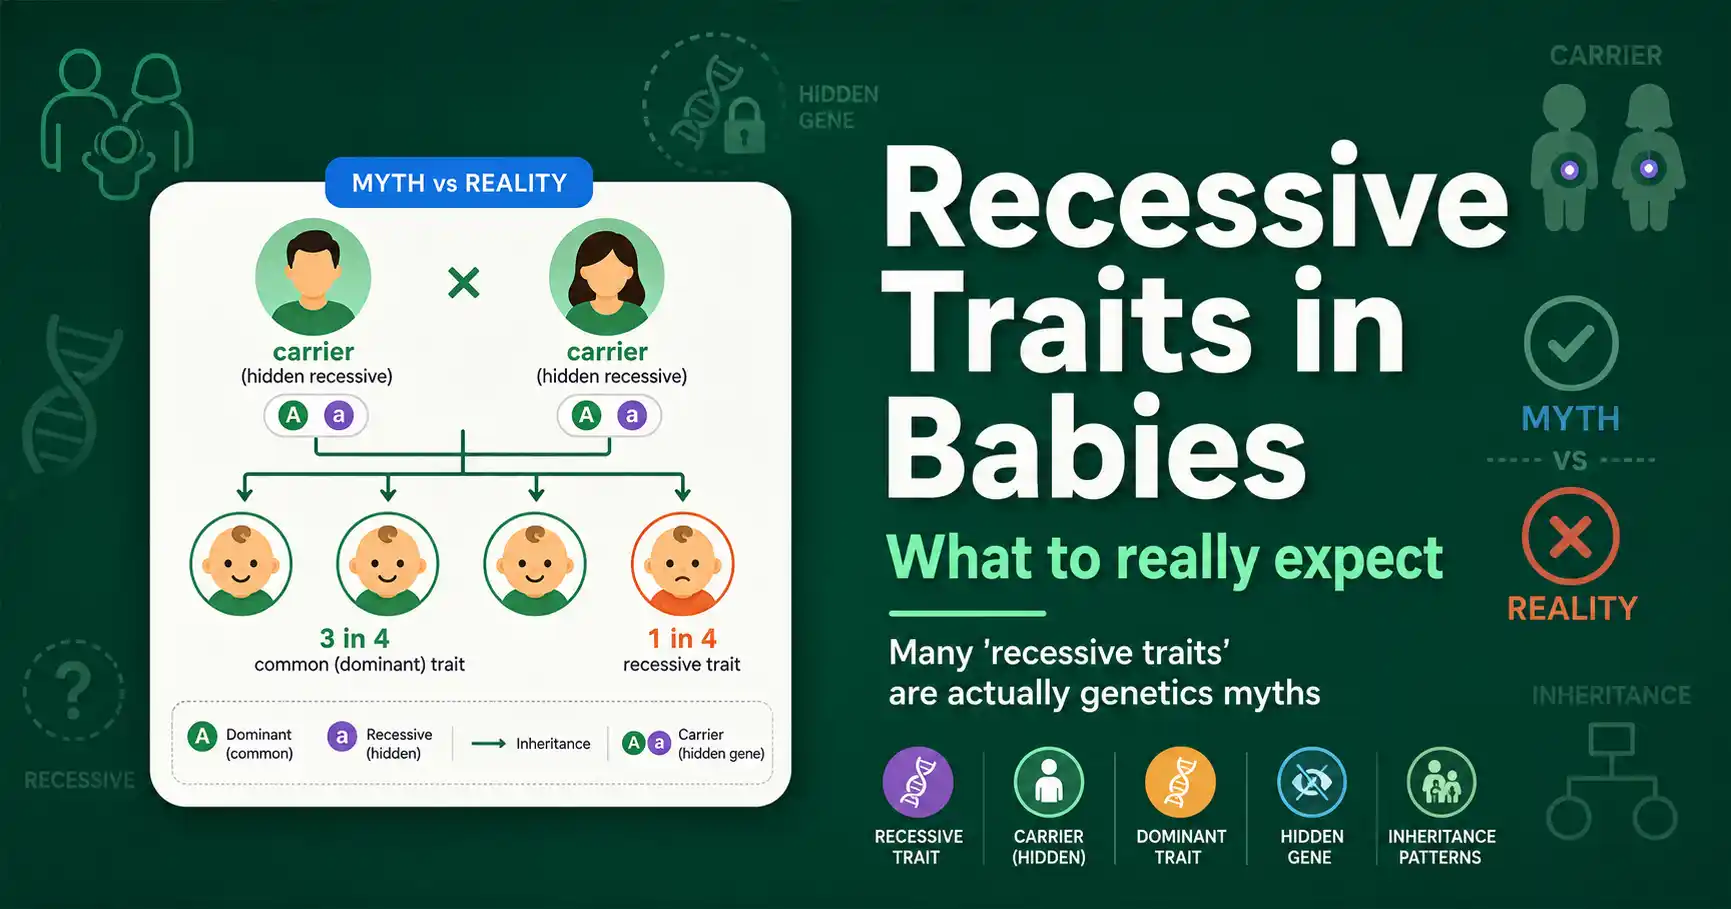
Recessive Traits in Babies: What to Really Expect
Many 'recessive' baby traits like tongue rolling and attached earlobes are genetics myths. Learn which traits are truly recessive, and how hidden genes really work.
10 min read
Genetics blog
Practical articles for students, teachers, and biology learners who want clear explanations of inheritance, probability, genotypes, phenotypes, and genetic calculator results.
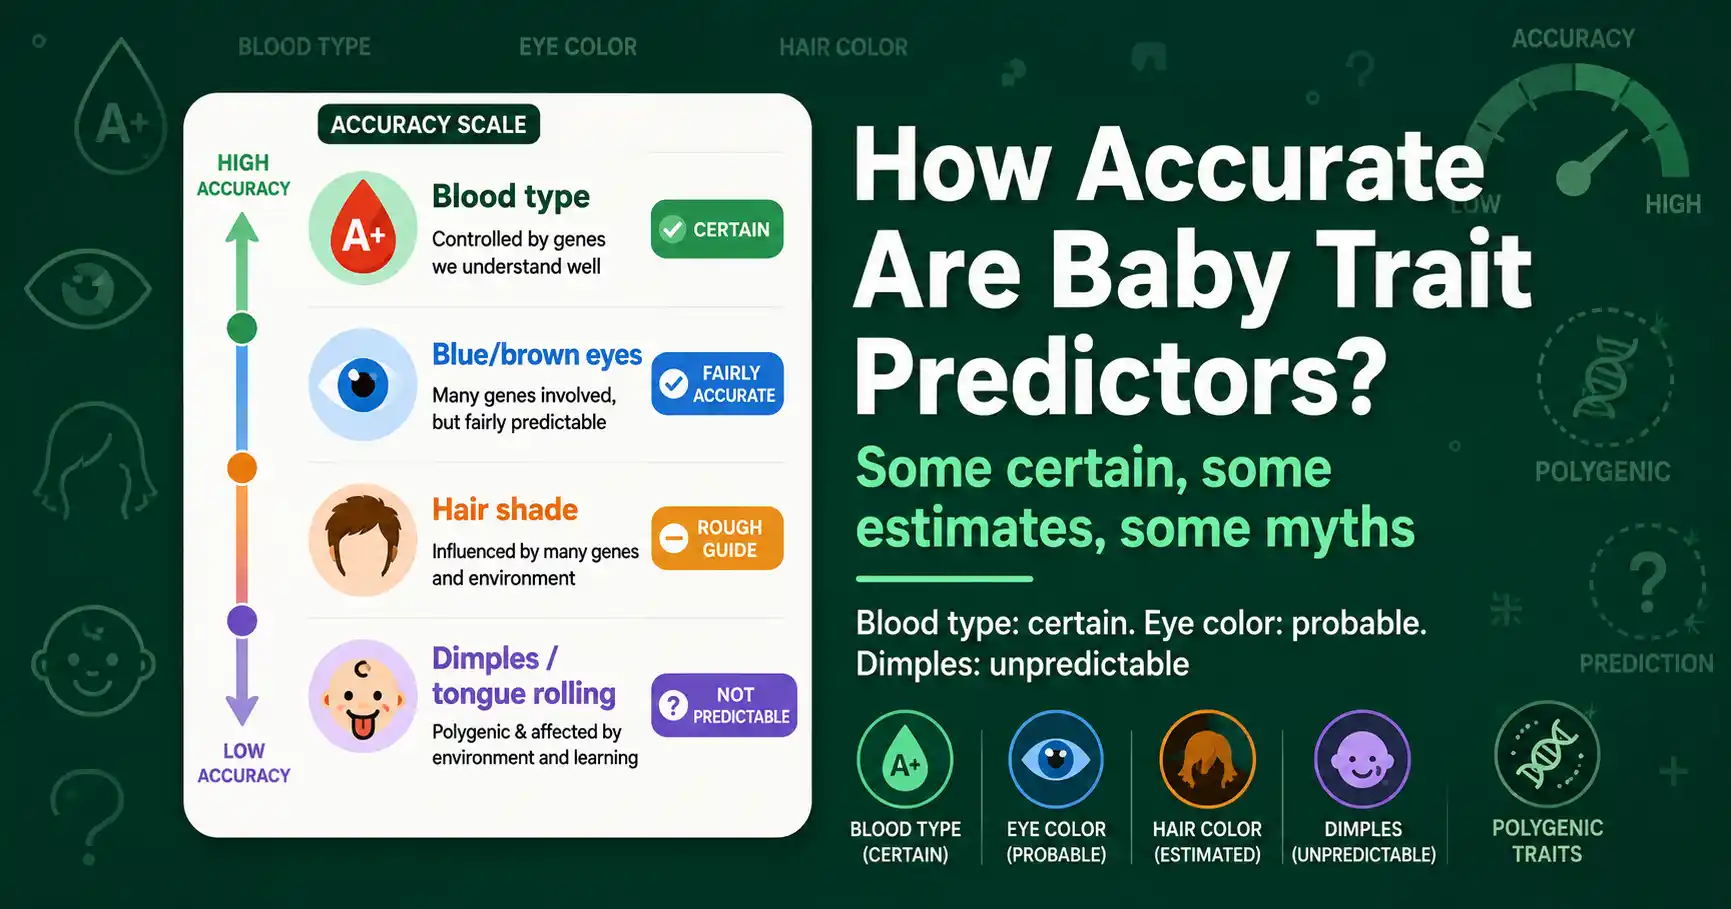
Baby trait predictors range from 100% accurate for blood type to educated guesses for eye and hair color, and pure myth for dimples and tongue rolling. Here is the honest breakdown.
Many 'recessive' baby traits like tongue rolling and attached earlobes are genetics myths. Learn which traits are truly recessive, and how hidden genes really work.
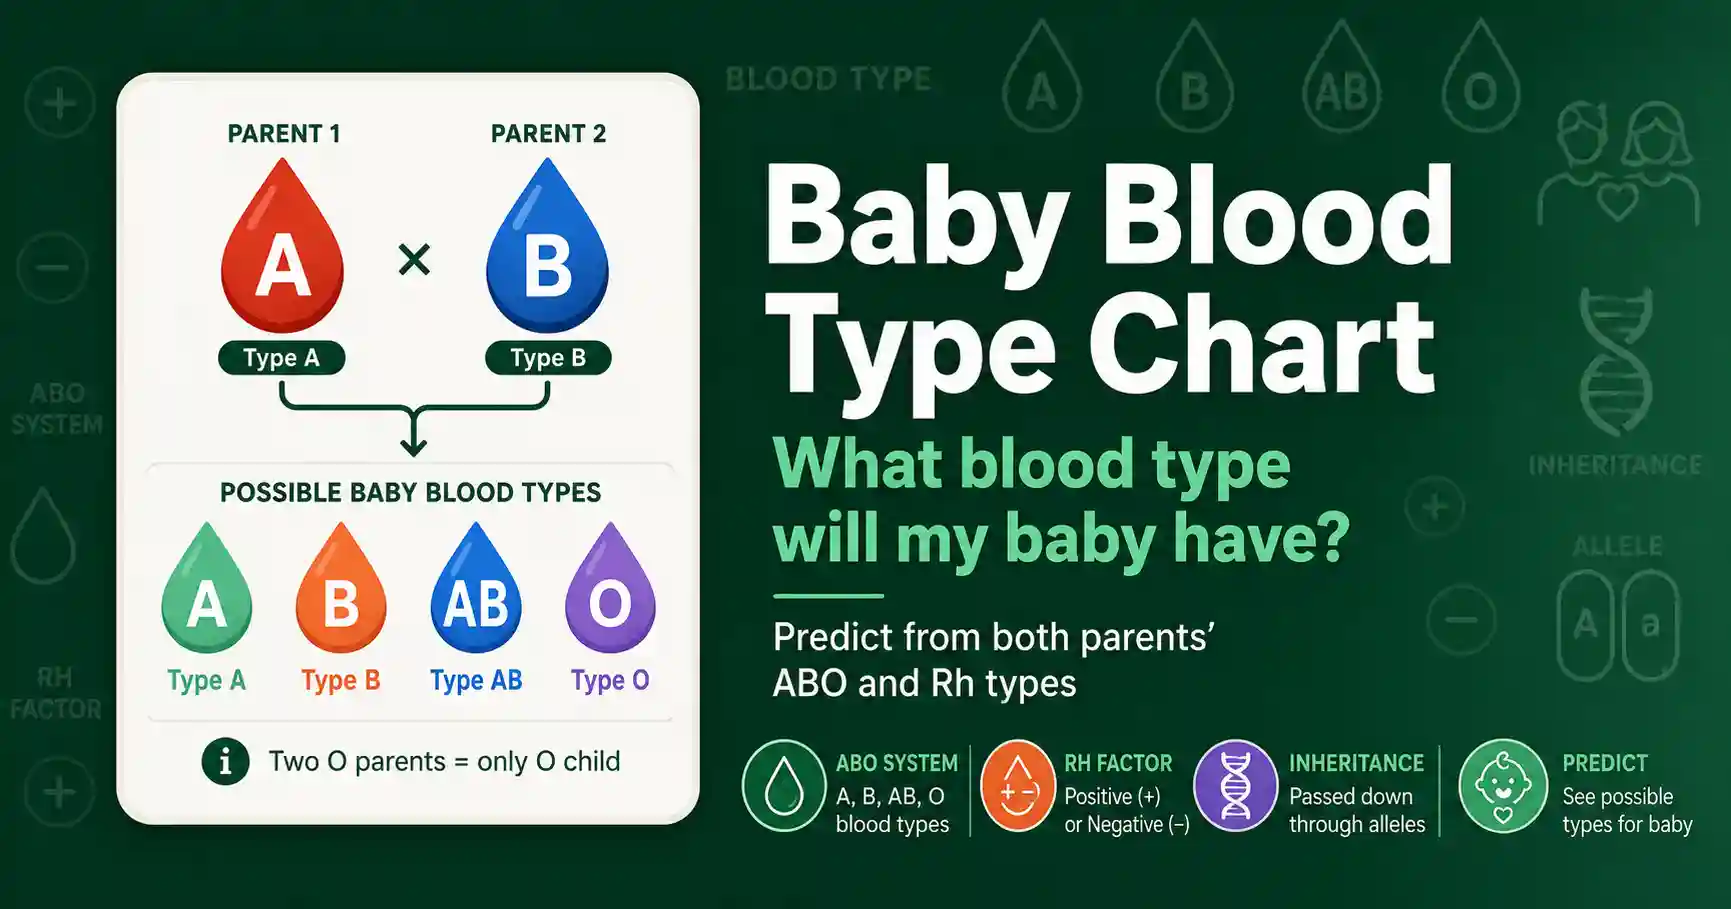
A baby's blood type comes from both parents' ABO and Rh genes. See the full inheritance chart for every parent combination, plus how the Rh factor is passed down.
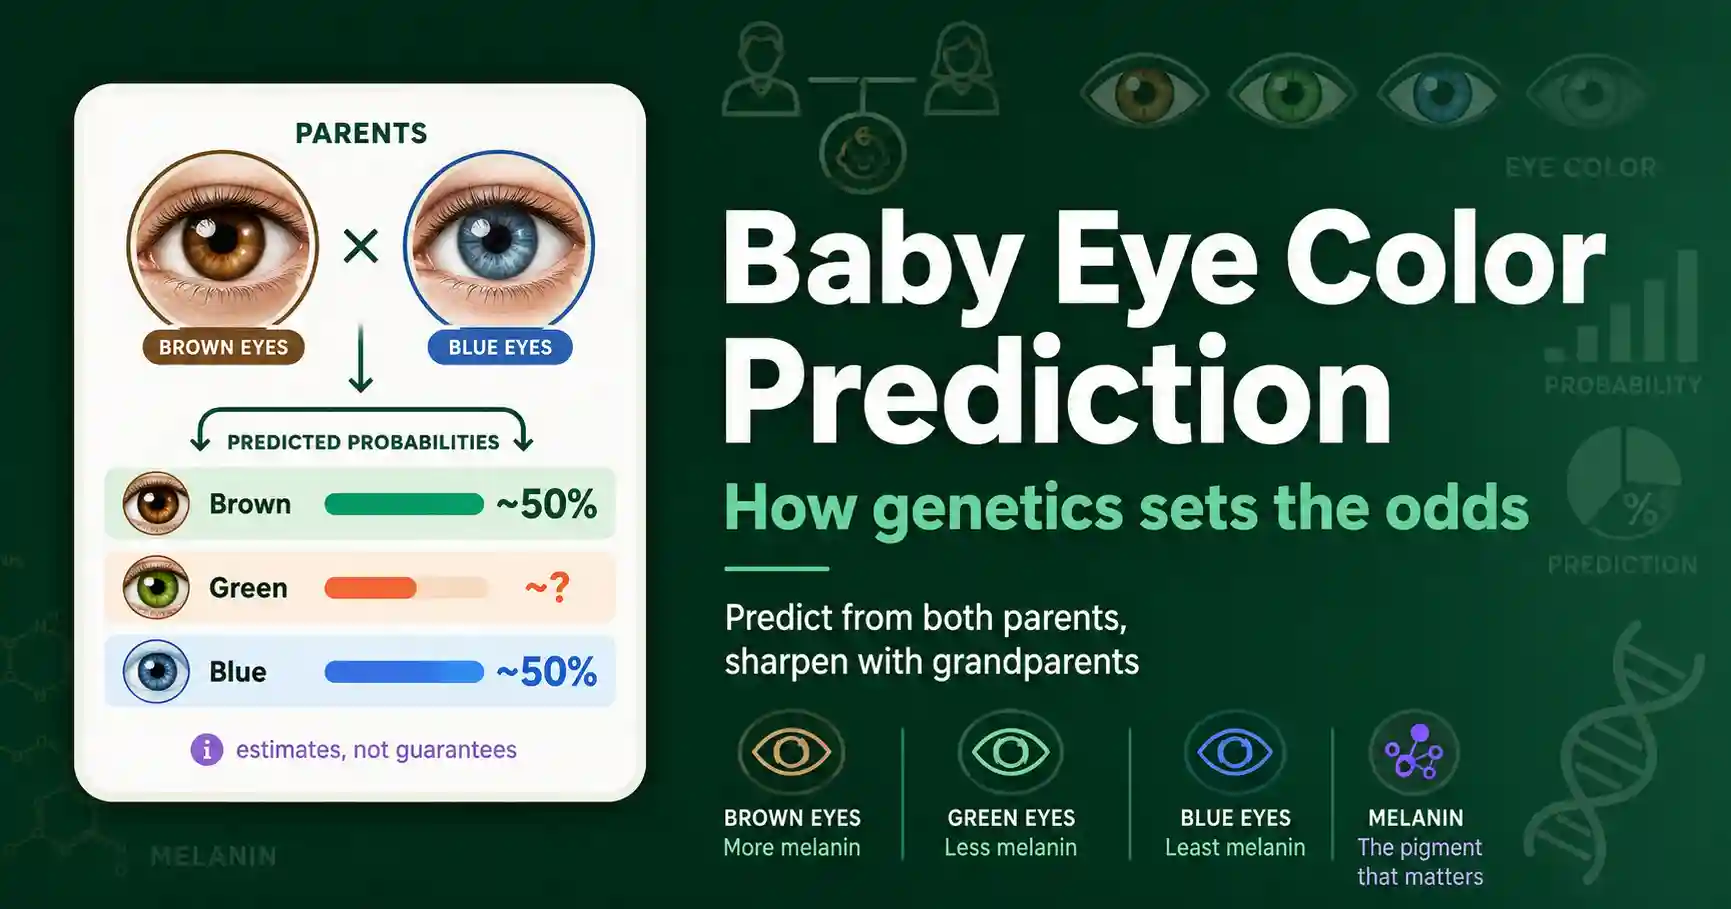
Predict your baby's eye color from both parents' eyes. See the probability chart, how grandparents shift the odds, and why eye color predictions are estimates, not guarantees.
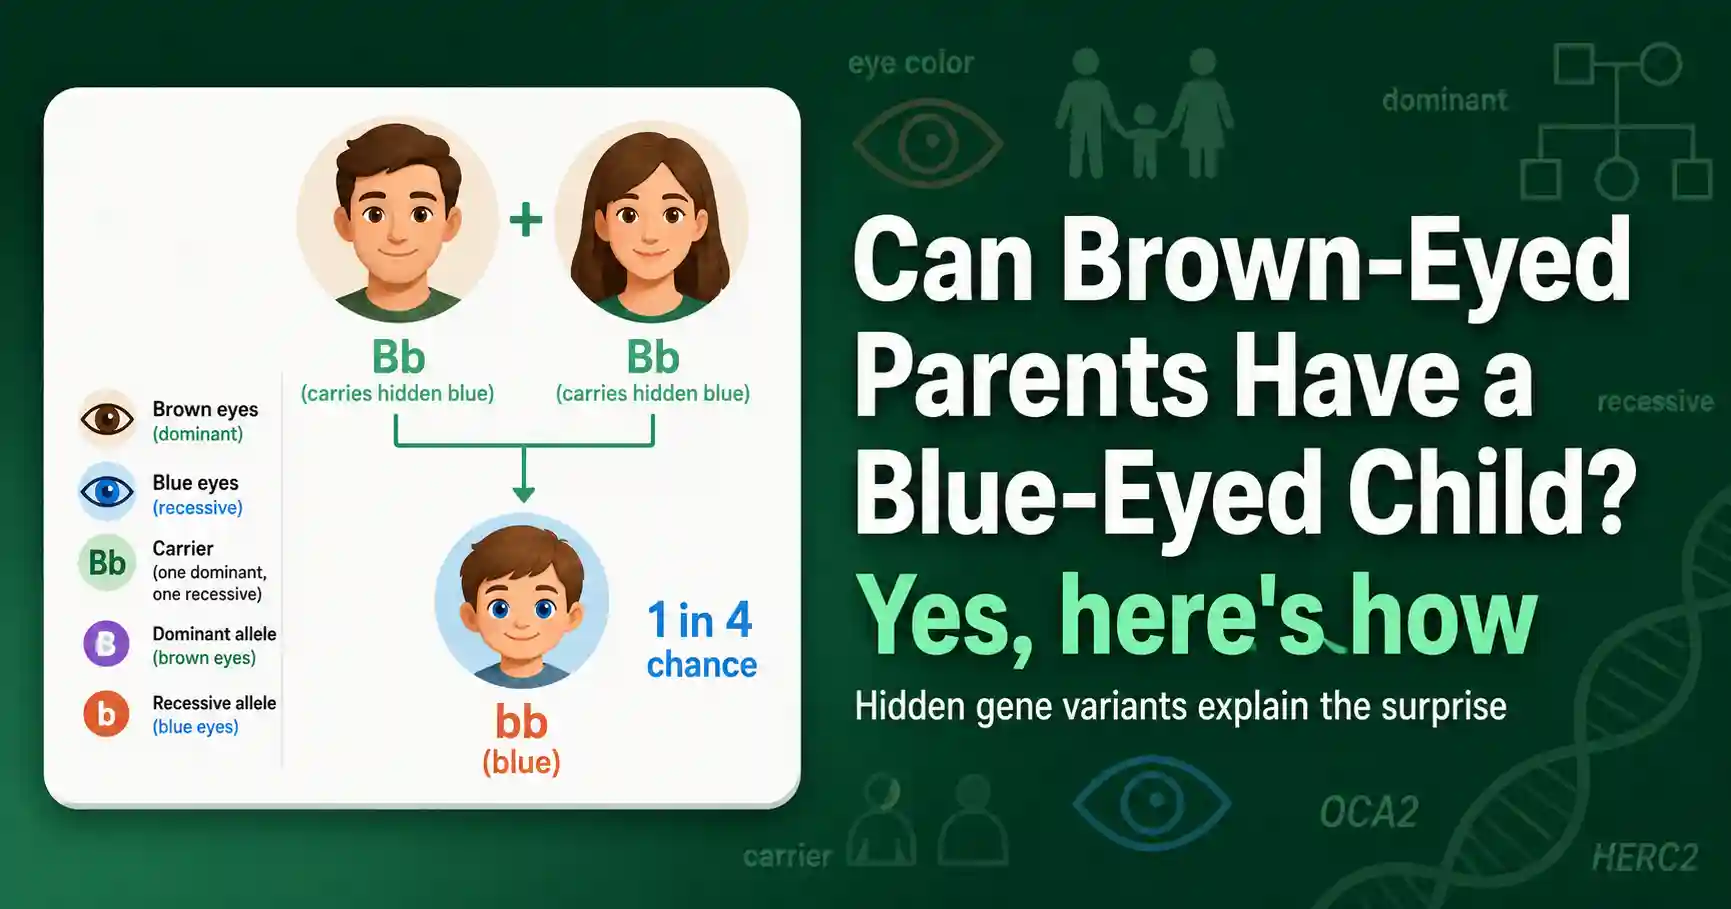
Yes, two brown-eyed parents can have a blue-eyed baby if both carry a hidden blue-eye variant. Here is how eye color inheritance really works, and why it is not so simple.
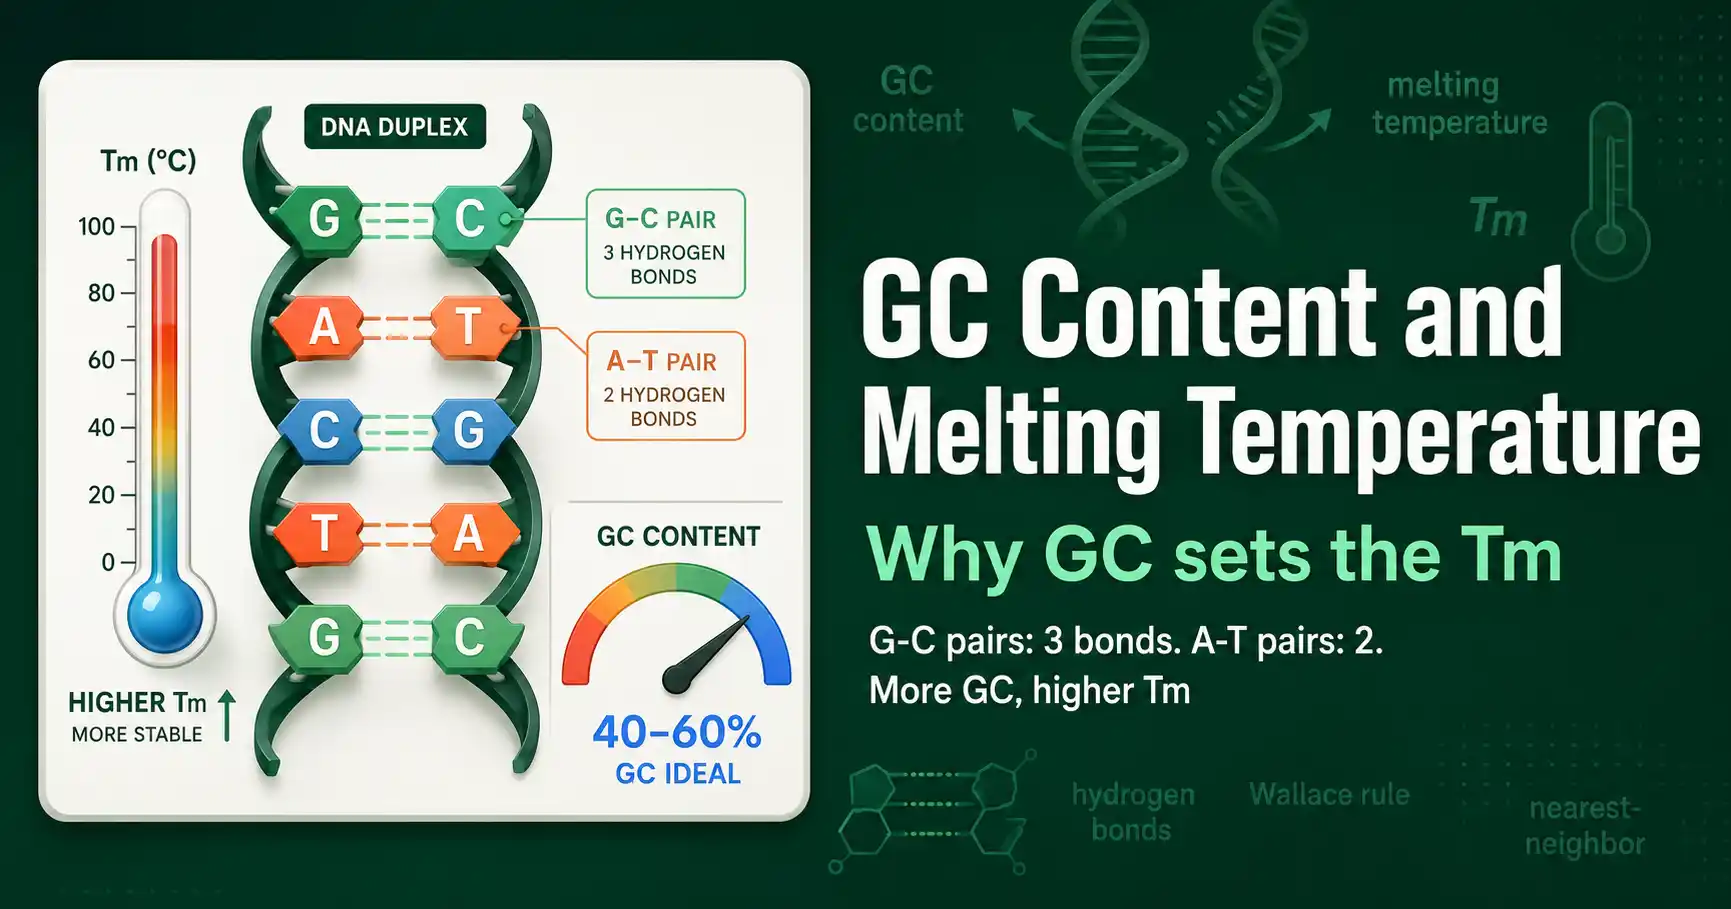
GC content is the percentage of G and C bases in a sequence, and it sets the melting temperature. Learn the Tm formulas, from the Wallace rule to nearest-neighbor, with examples.
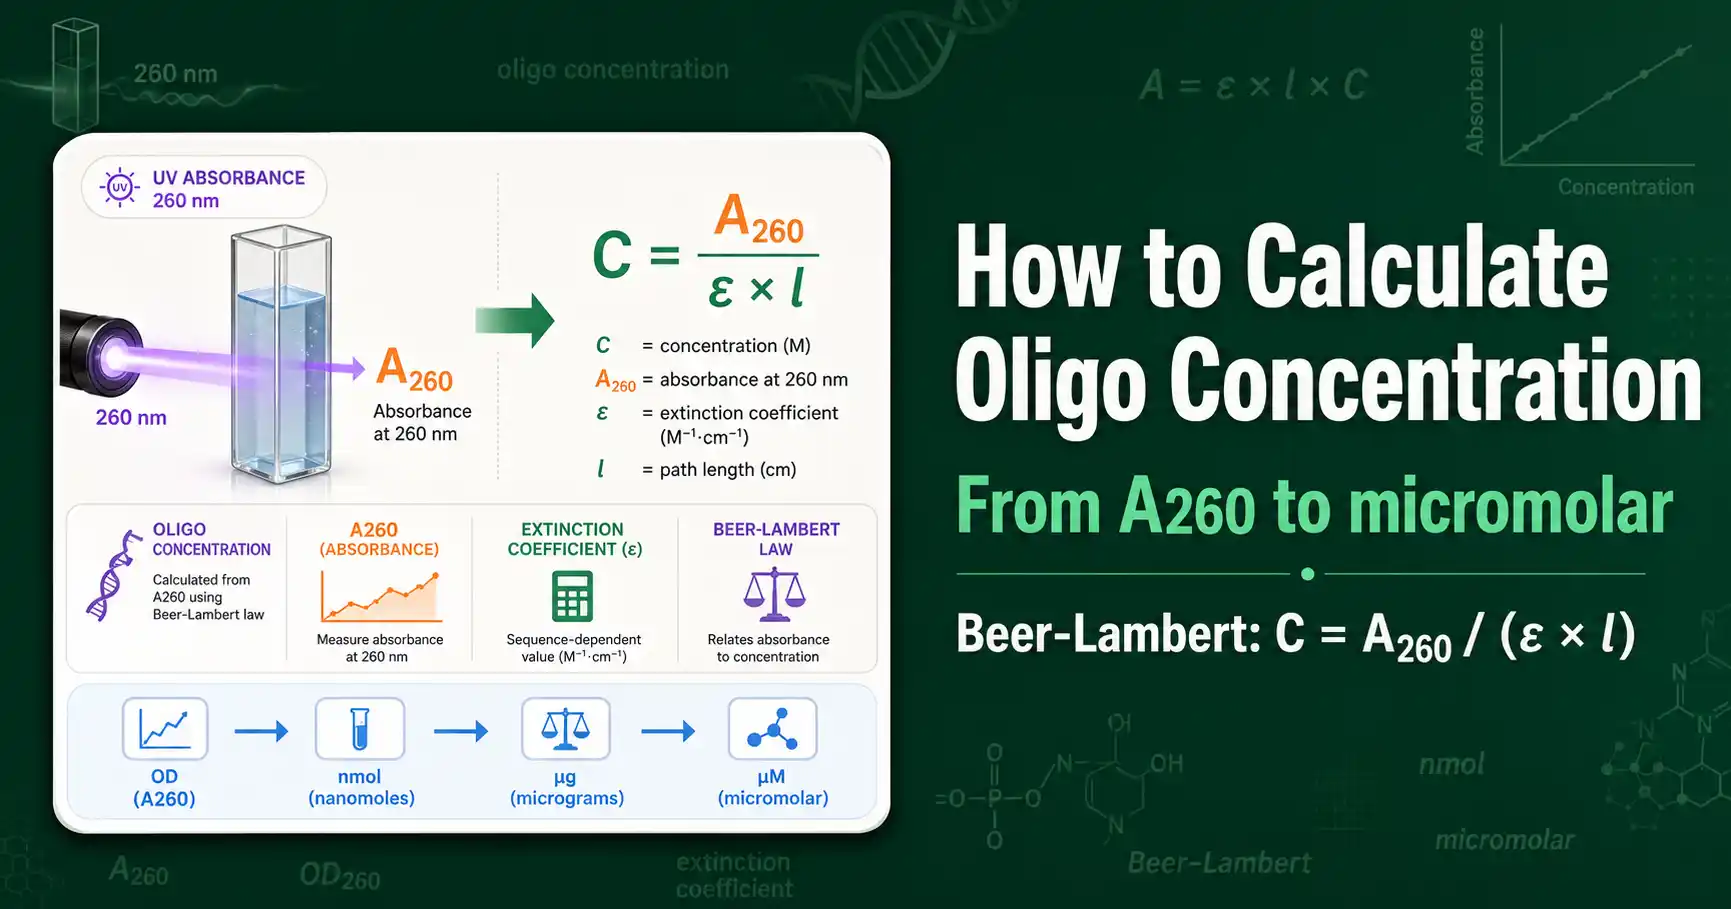
Calculate oligo concentration from OD260 using the Beer-Lambert law and the extinction coefficient. Convert between OD260, nmol, micrograms, and micromolar with worked examples.
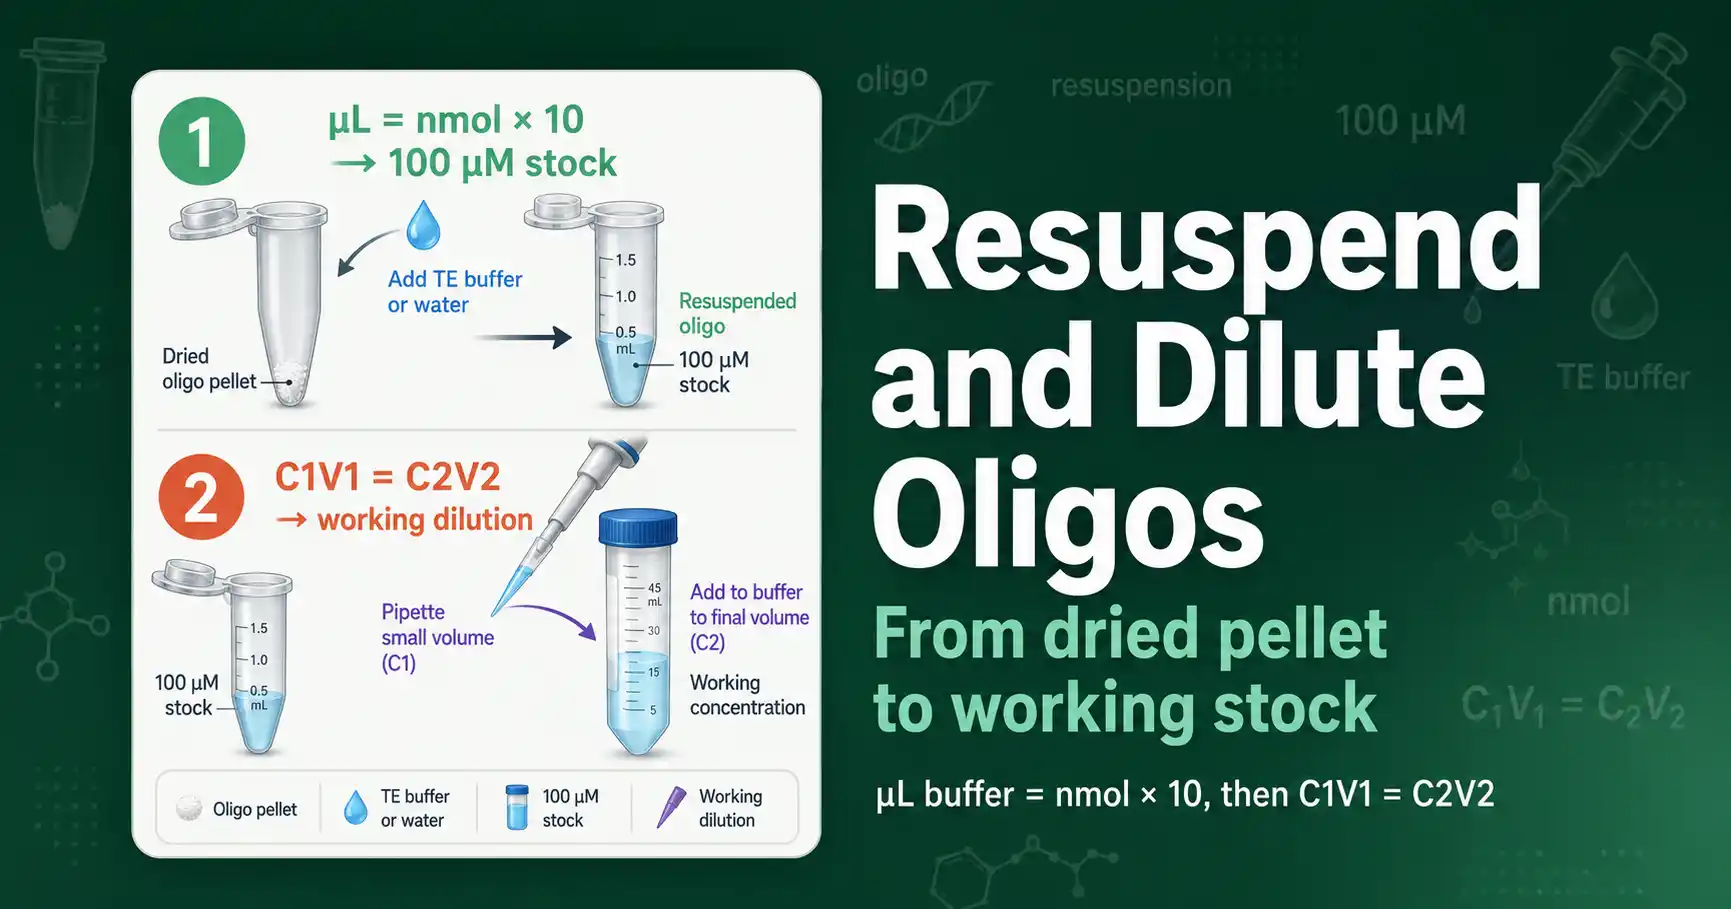
Resuspend a dried oligo to a 100 micromolar stock by adding microliters of buffer equal to ten times the nanomoles. Then dilute to working concentration with C1V1 = C2V2.
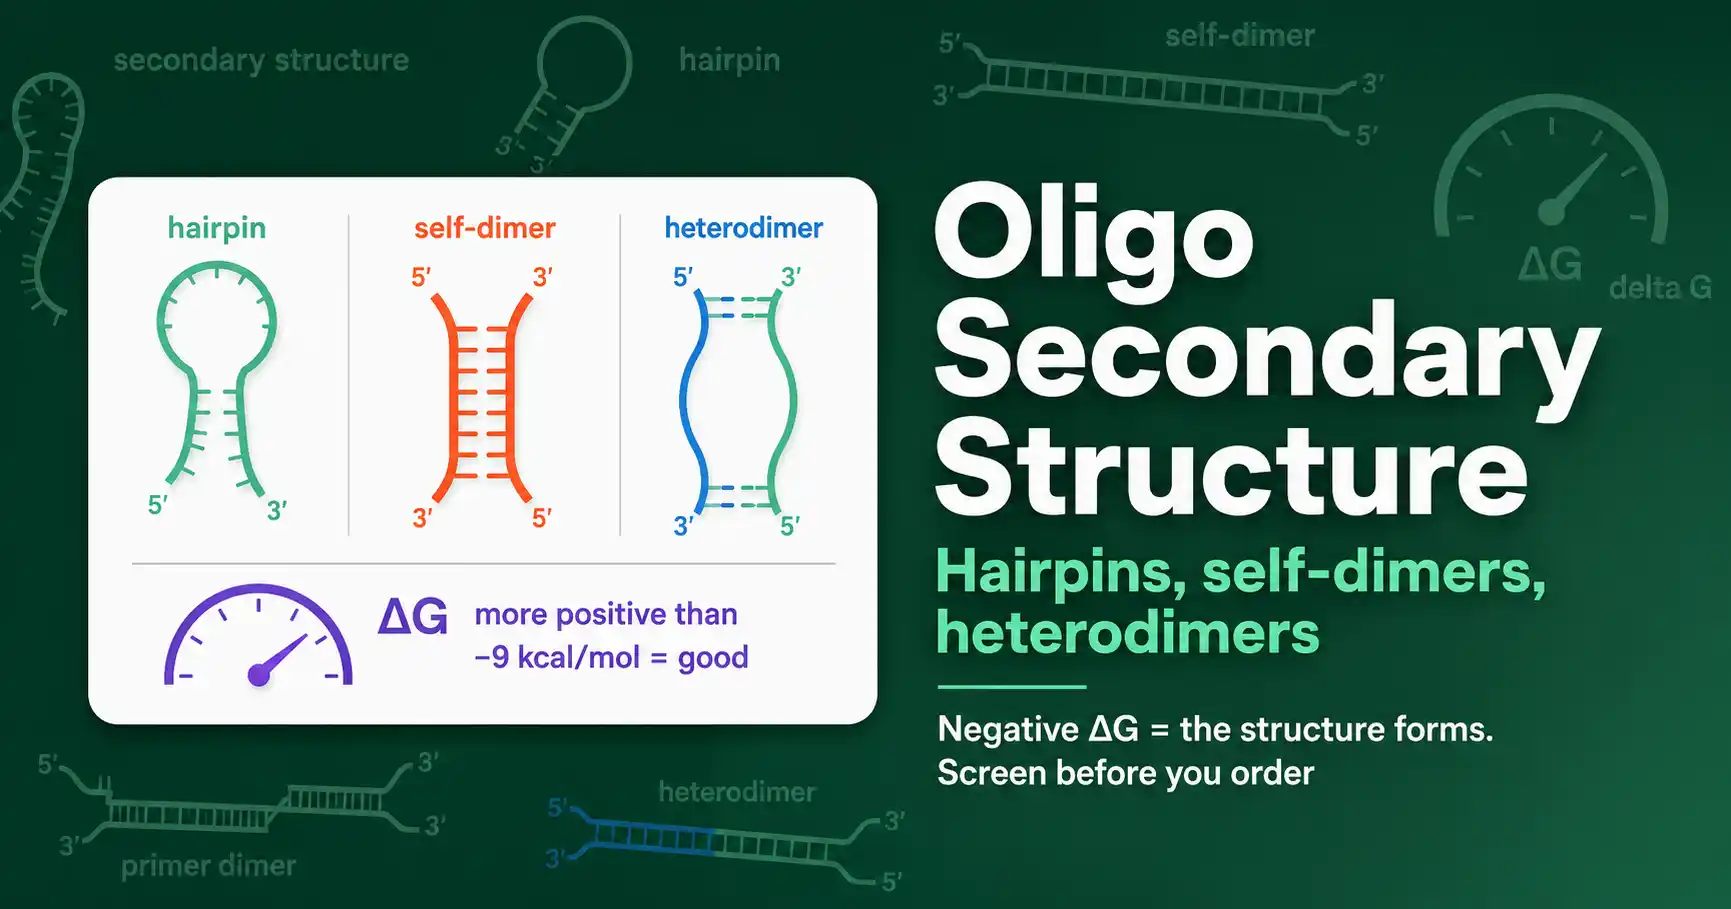
Oligo secondary structures, hairpins, self-dimers, and heterodimers, reduce primer performance. Learn how they form, how to read delta G, and how to fix problem oligos.
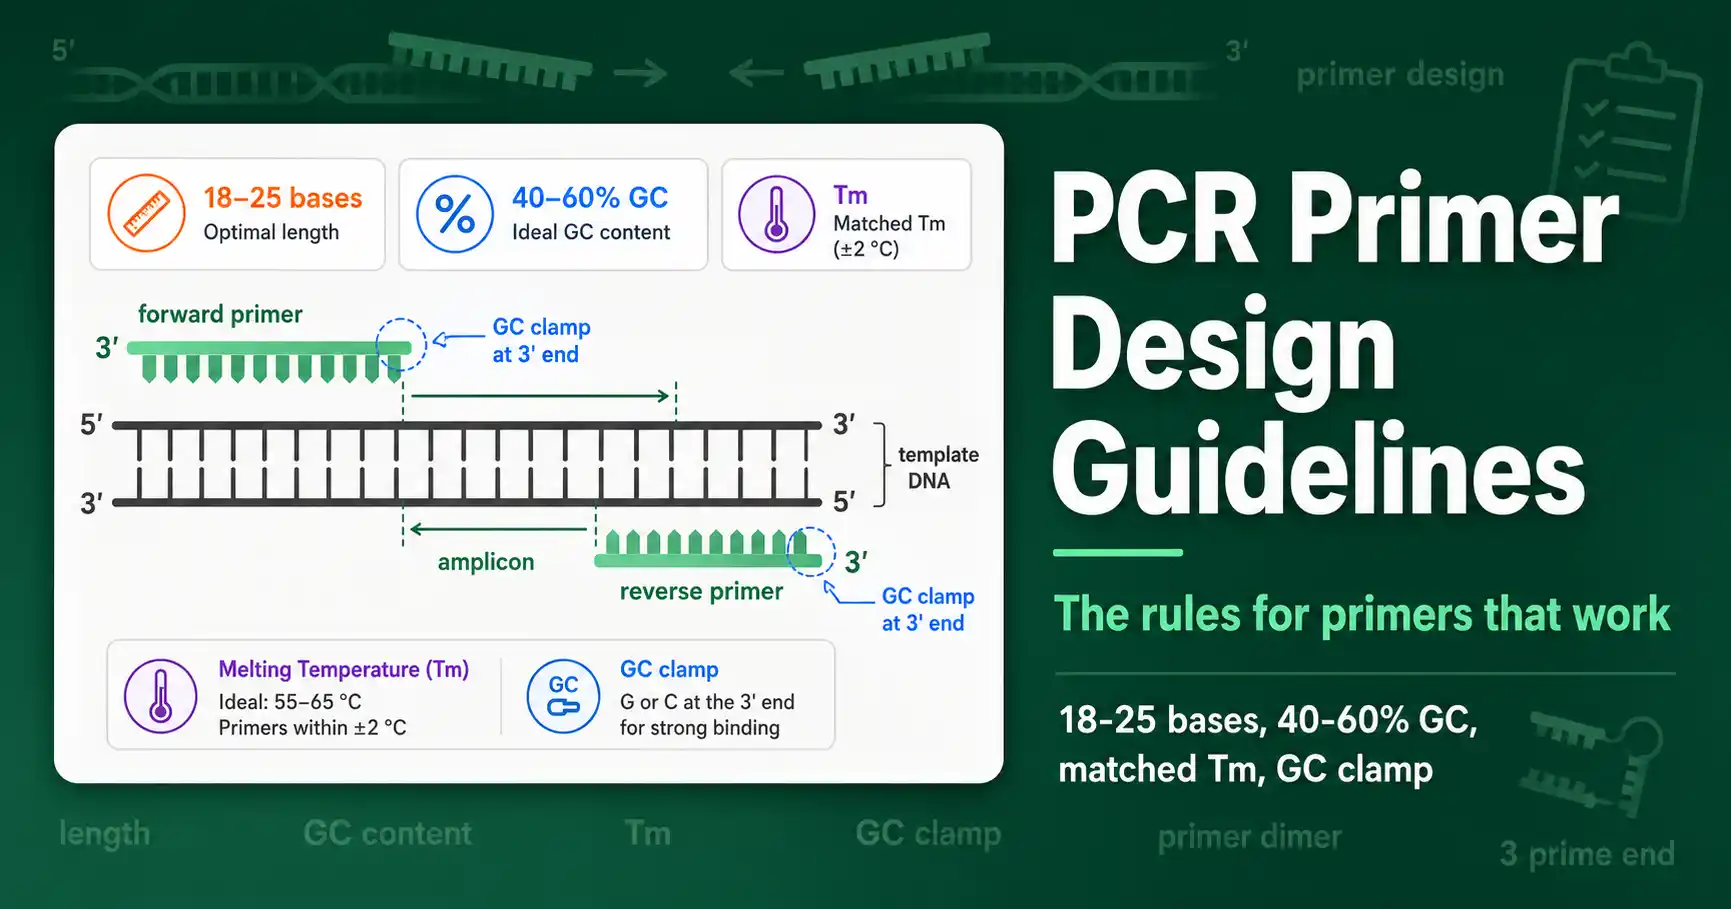
Design PCR primers that work: 18 to 25 bases, 40 to 60 percent GC, matched melting temperatures, a 3-prime GC clamp, and no hairpins or dimers. A practical guide with a checklist.
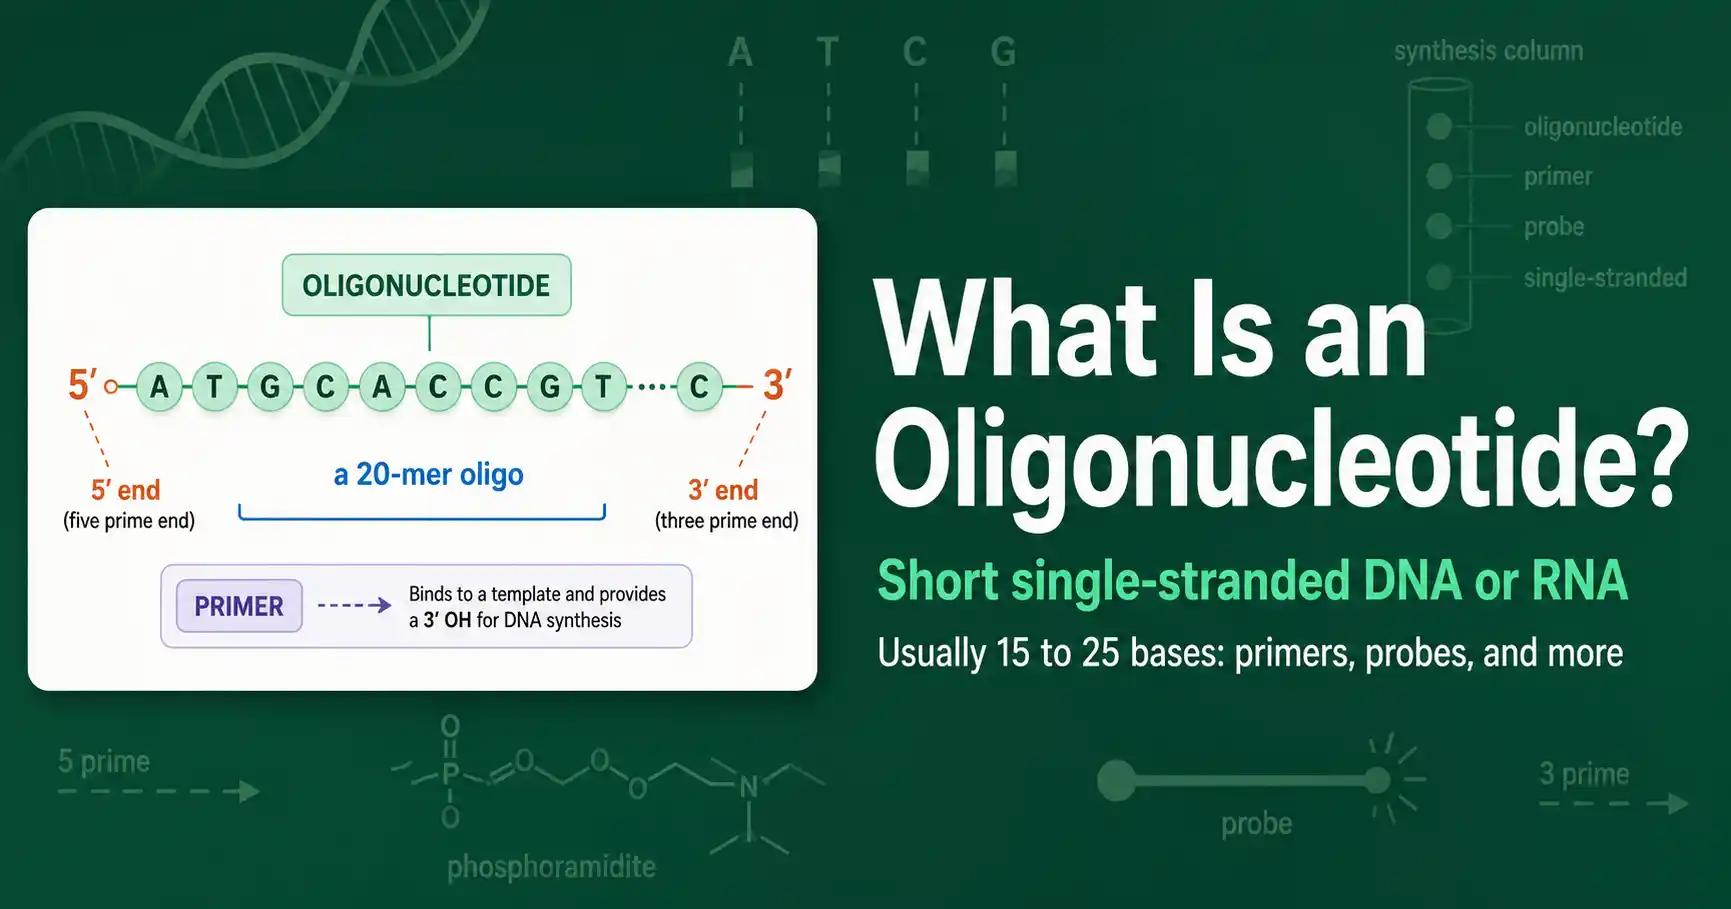
An oligonucleotide is a short, single-stranded piece of synthetic DNA or RNA, usually 15 to 25 bases long. Learn what oligos are, how they are made, and what they are used for.
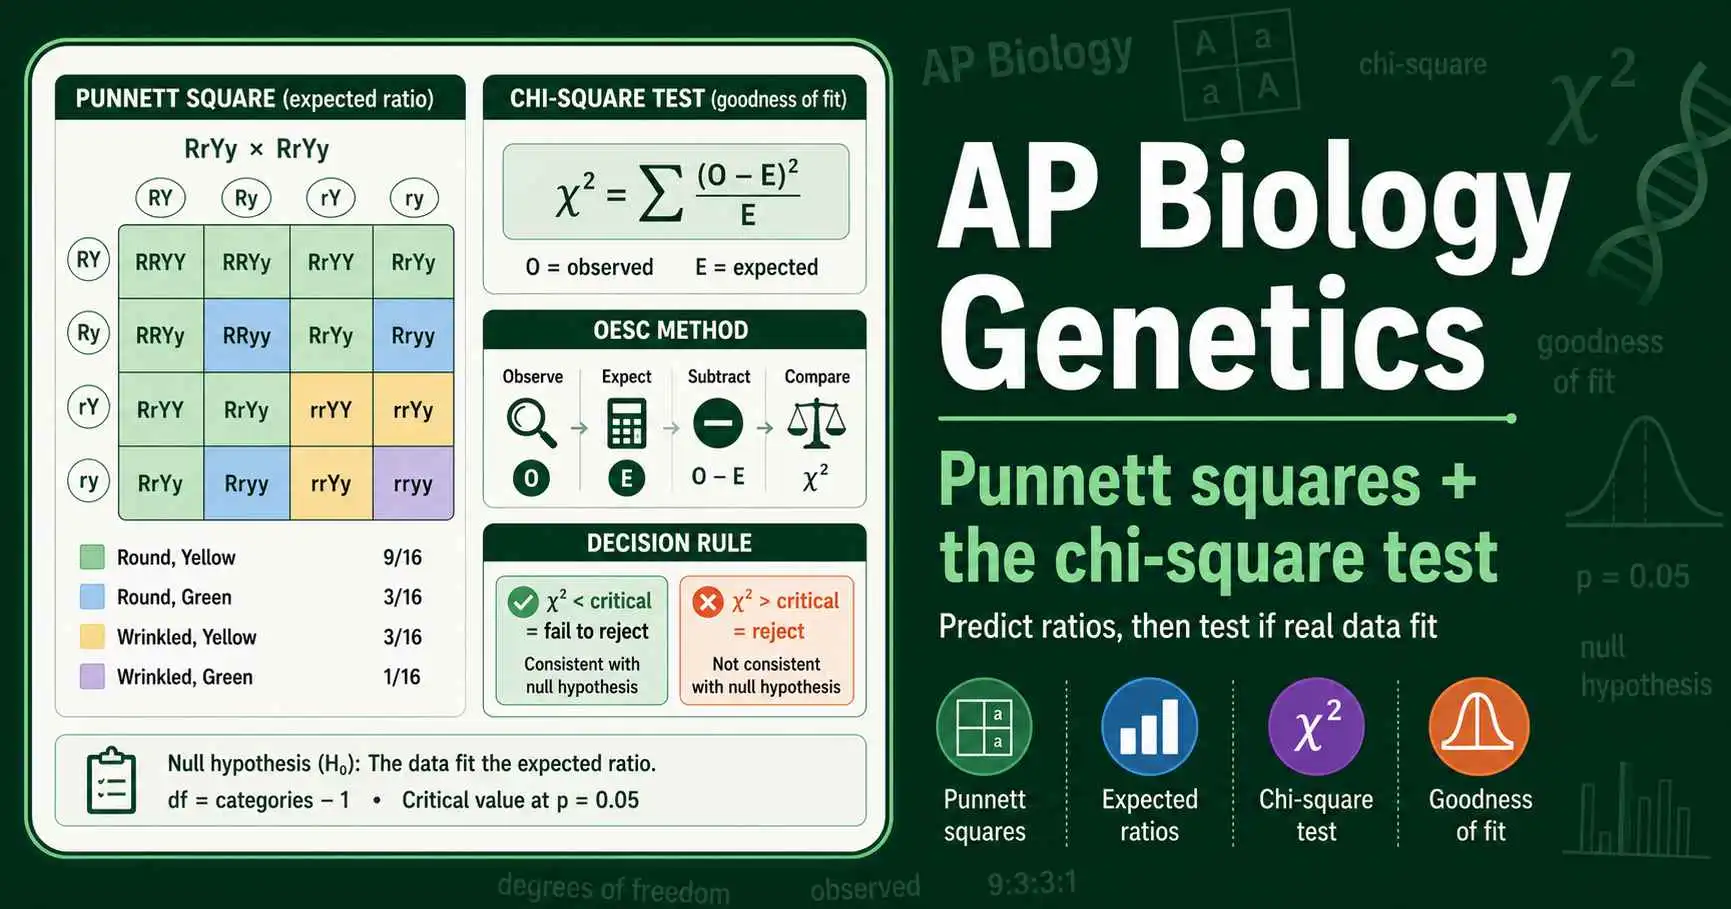
Master AP Biology genetics: Punnett squares, the chi-square goodness-of-fit test, degrees of freedom, critical values, and worked practice problems with conclusions.
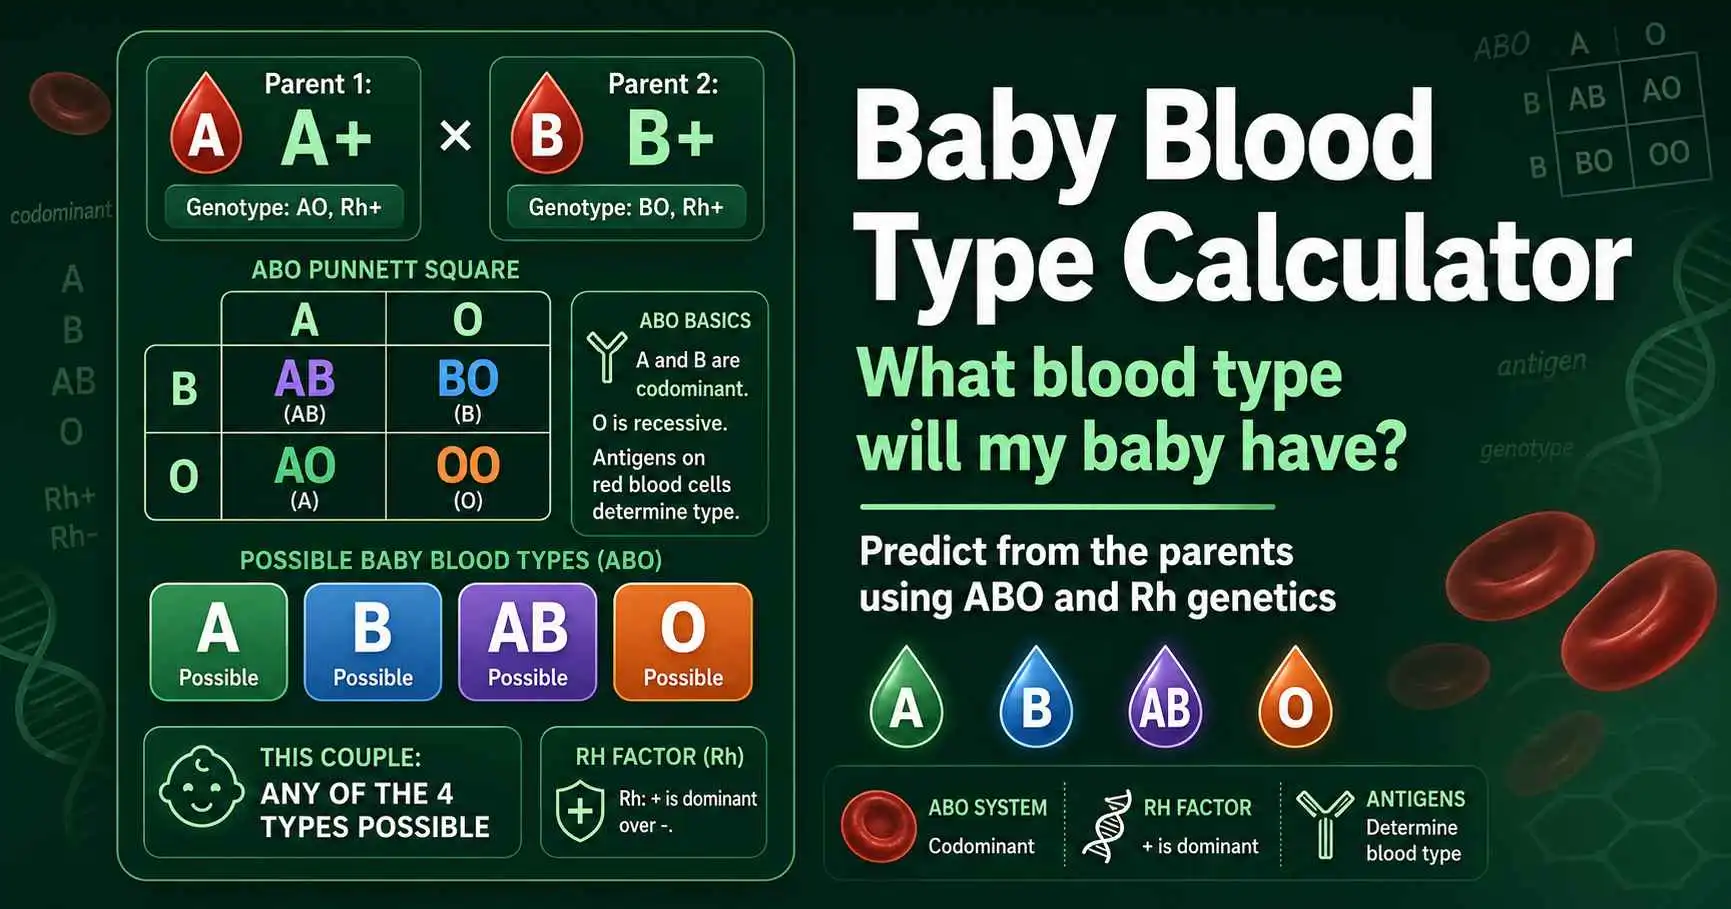
Predict your baby's blood type from the parents' types. Covers ABO and Rh inheritance, full parent-combination charts, Rh incompatibility, and why O and AB surprise people.
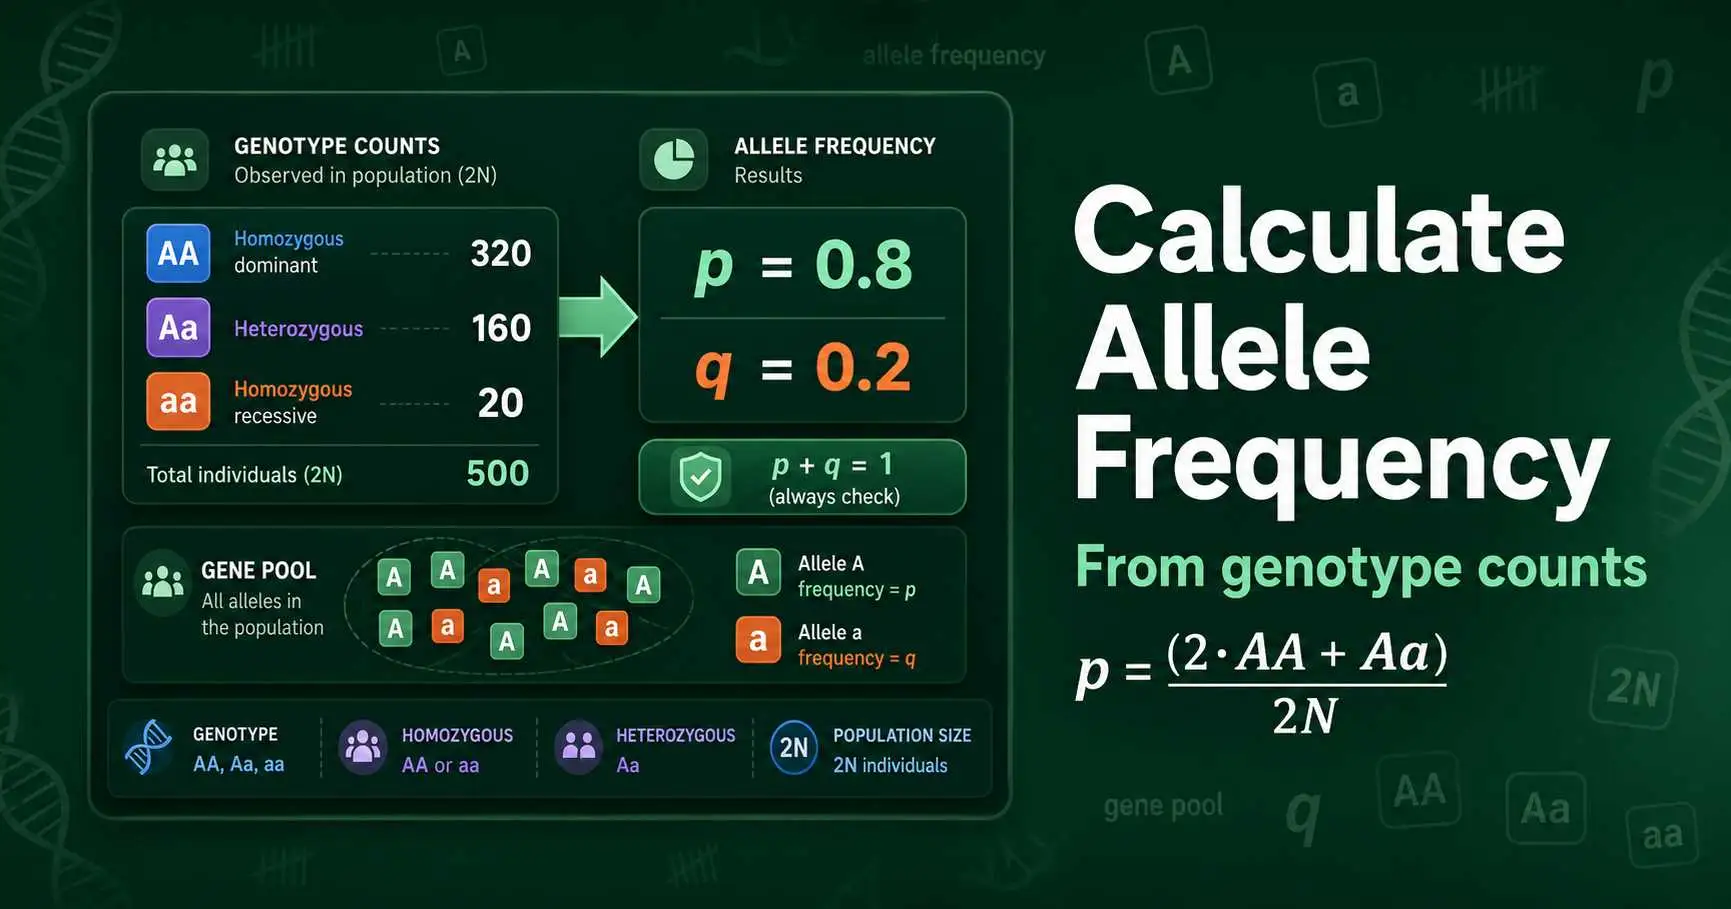
Learn how to calculate allele frequency from genotype counts using the counting method, p = (2·AA + Aa) / 2N, plus the genotype-frequency method and worked examples.
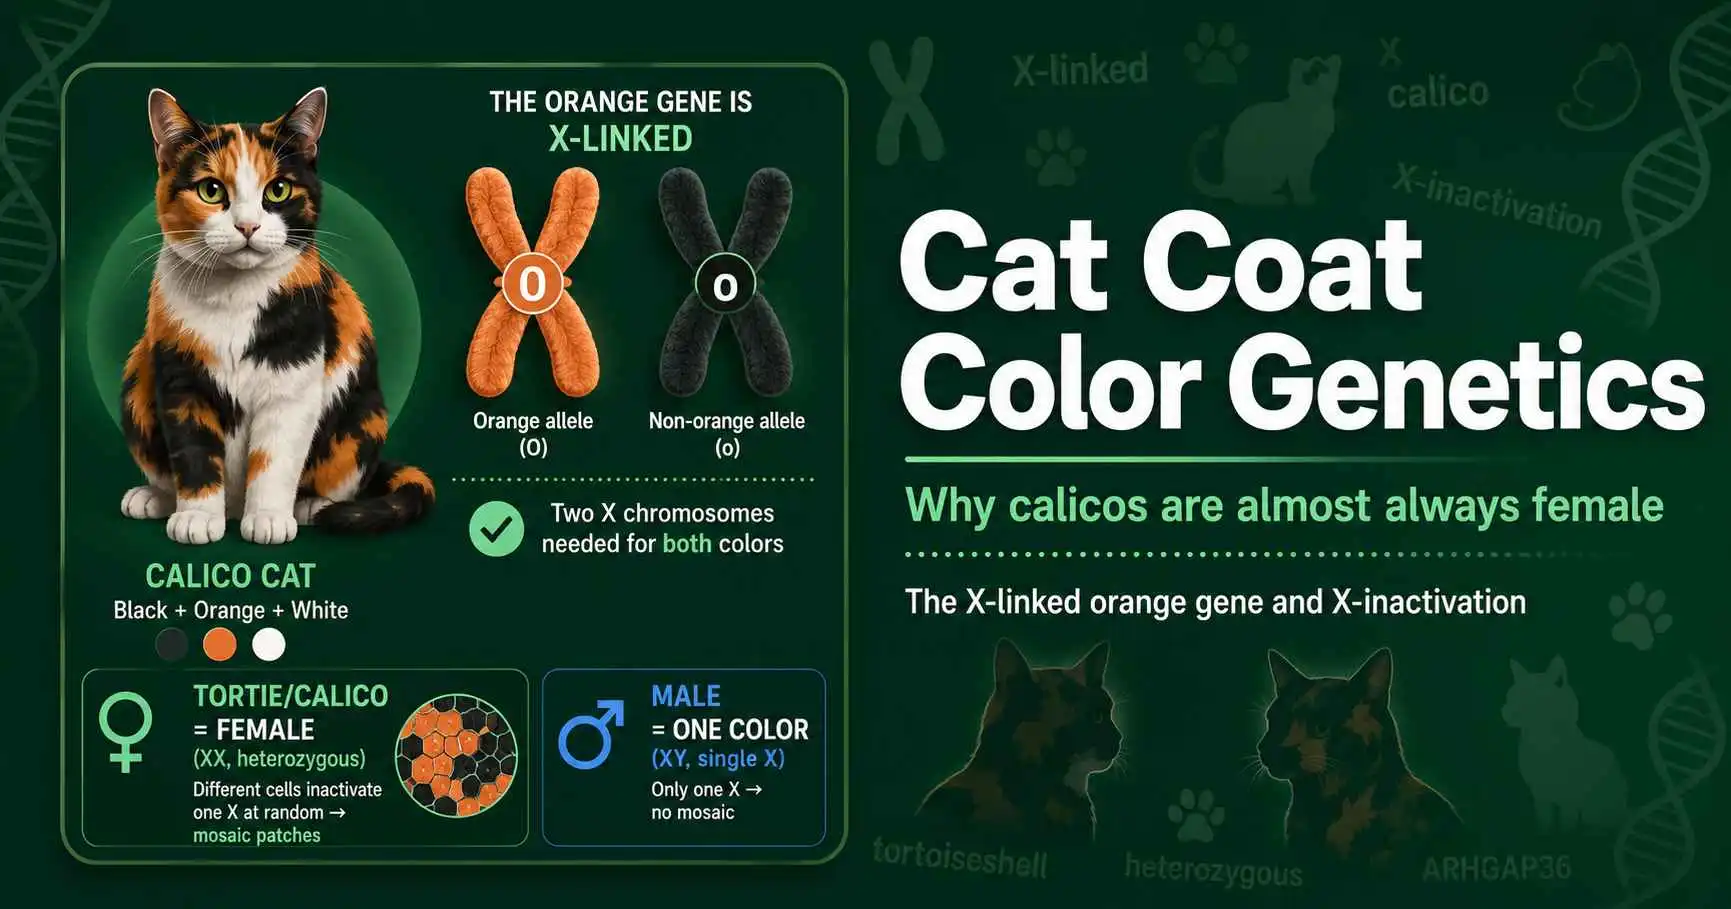
How cat coat color genetics works: the X-linked orange gene, why calico and tortoiseshell cats are almost always female, and how to predict kitten colors.
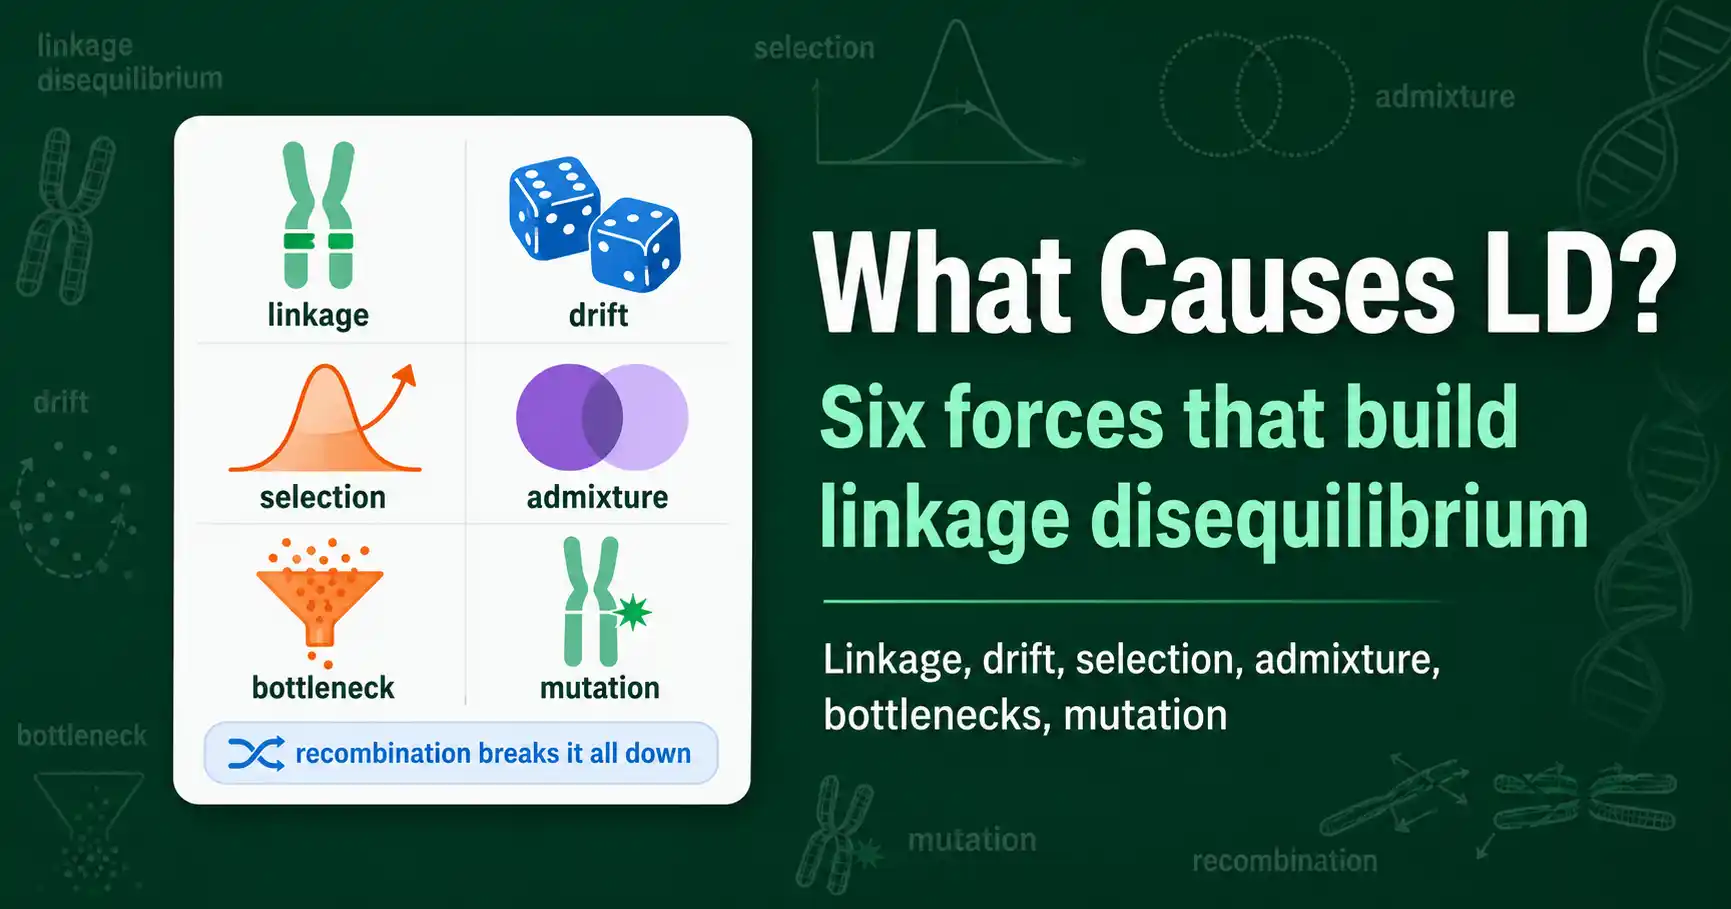
Linkage disequilibrium is created by physical linkage, genetic drift, selection, admixture, bottlenecks, and mutation. Here is how each force generates LD, even between unlinked loci.
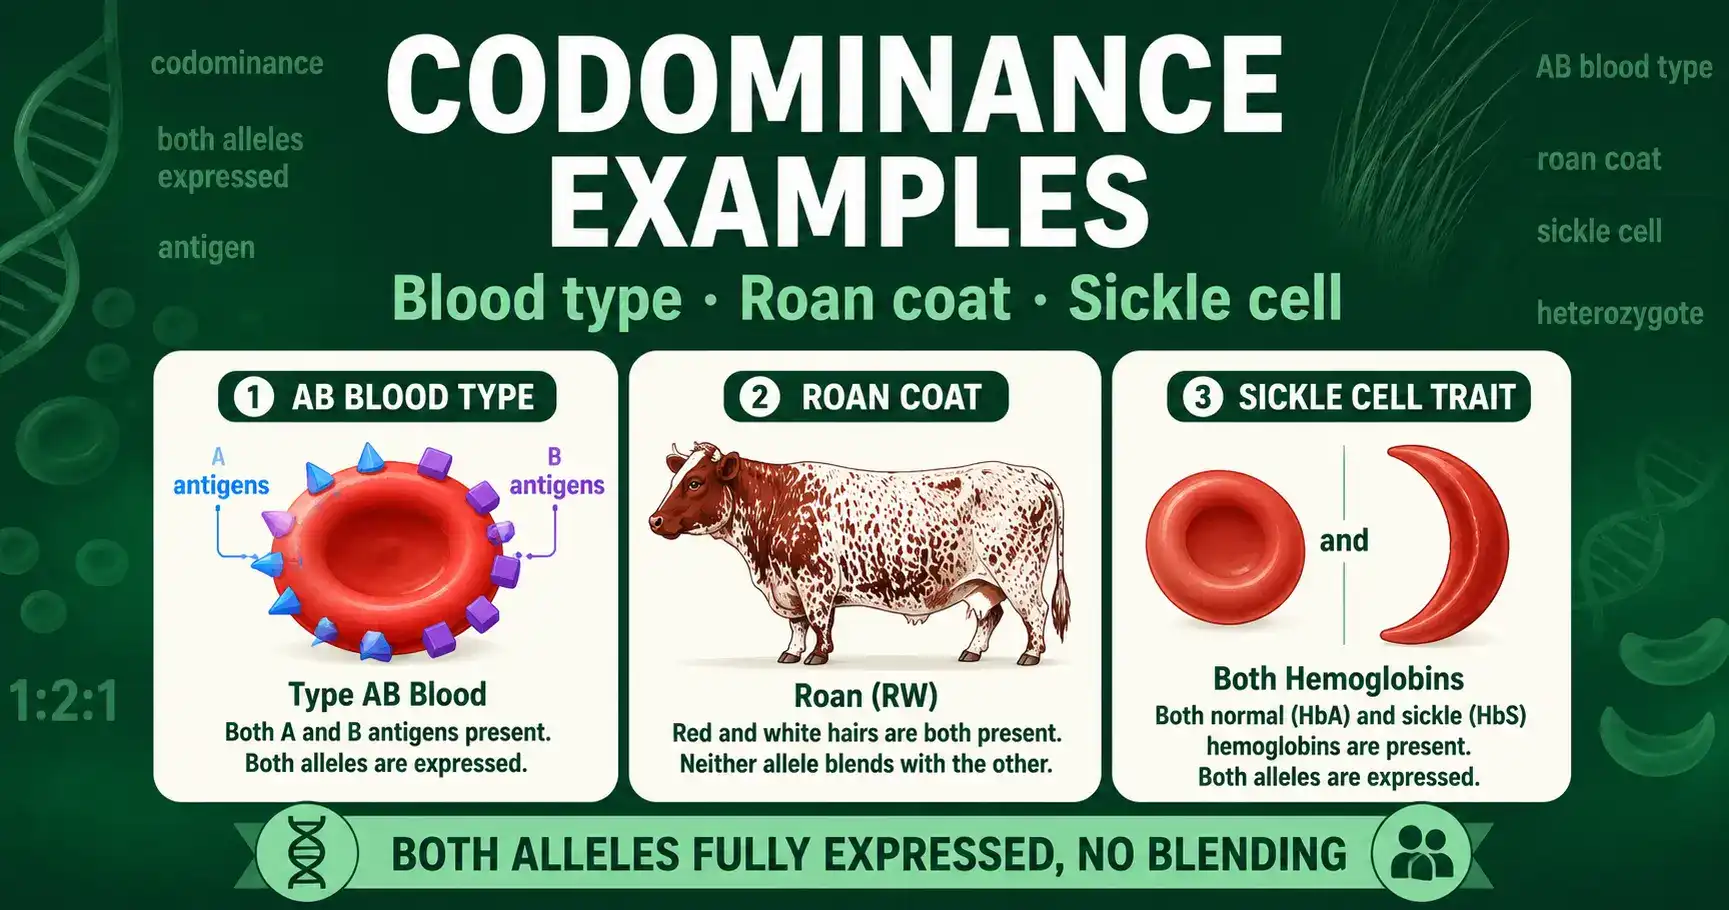
The clearest codominance examples explained: ABO blood type, roan coat color, and sickle cell trait, with worked Punnett squares and genotype tables.
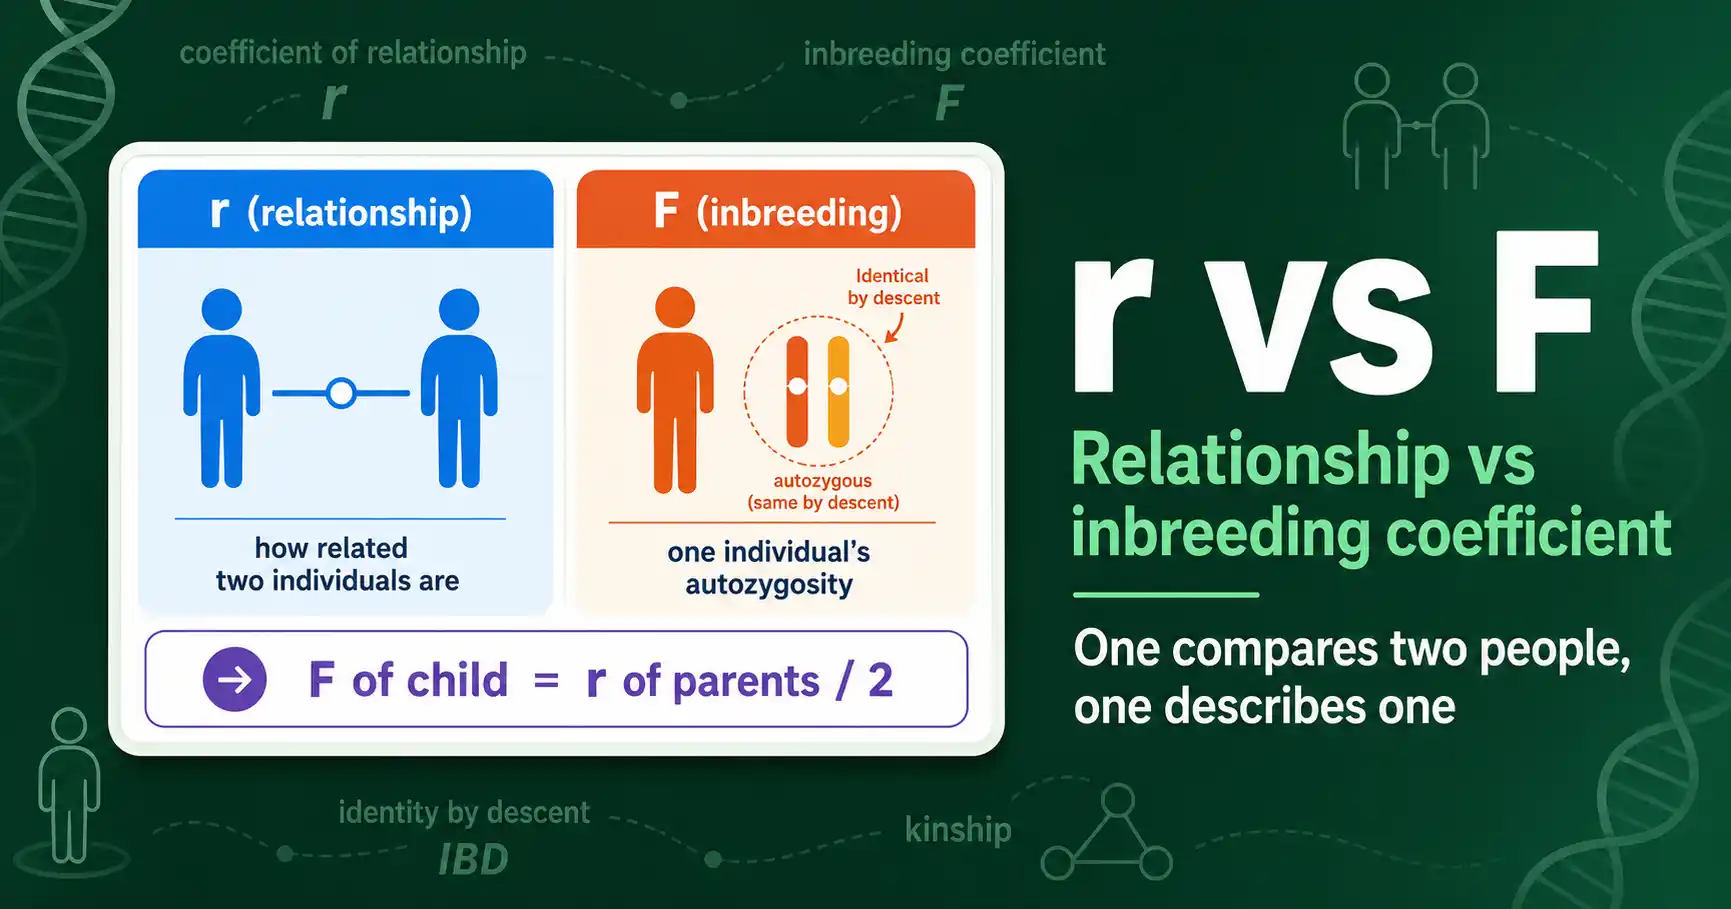
The coefficient of relationship (r) measures how related two individuals are; the inbreeding coefficient (F) measures one individual's autozygosity. Here is how r and F differ and connect.
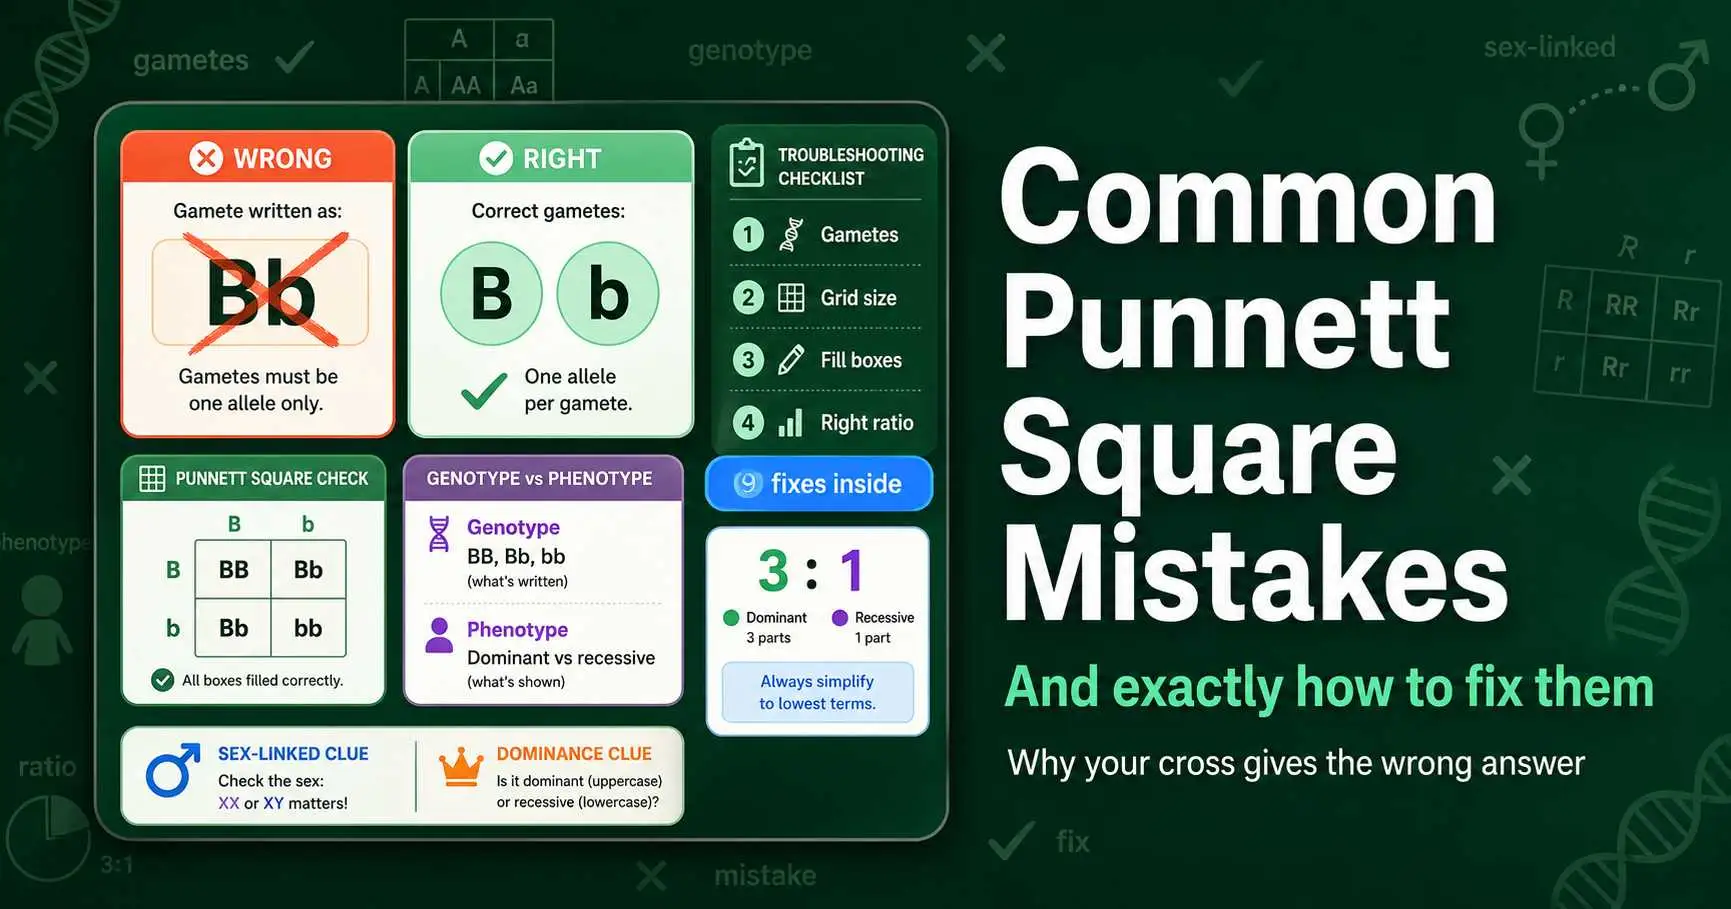
The most common Punnett square mistakes and how to fix them: gamete errors, genotype vs phenotype ratios, sex-linkage slips, and the dominance misconception.
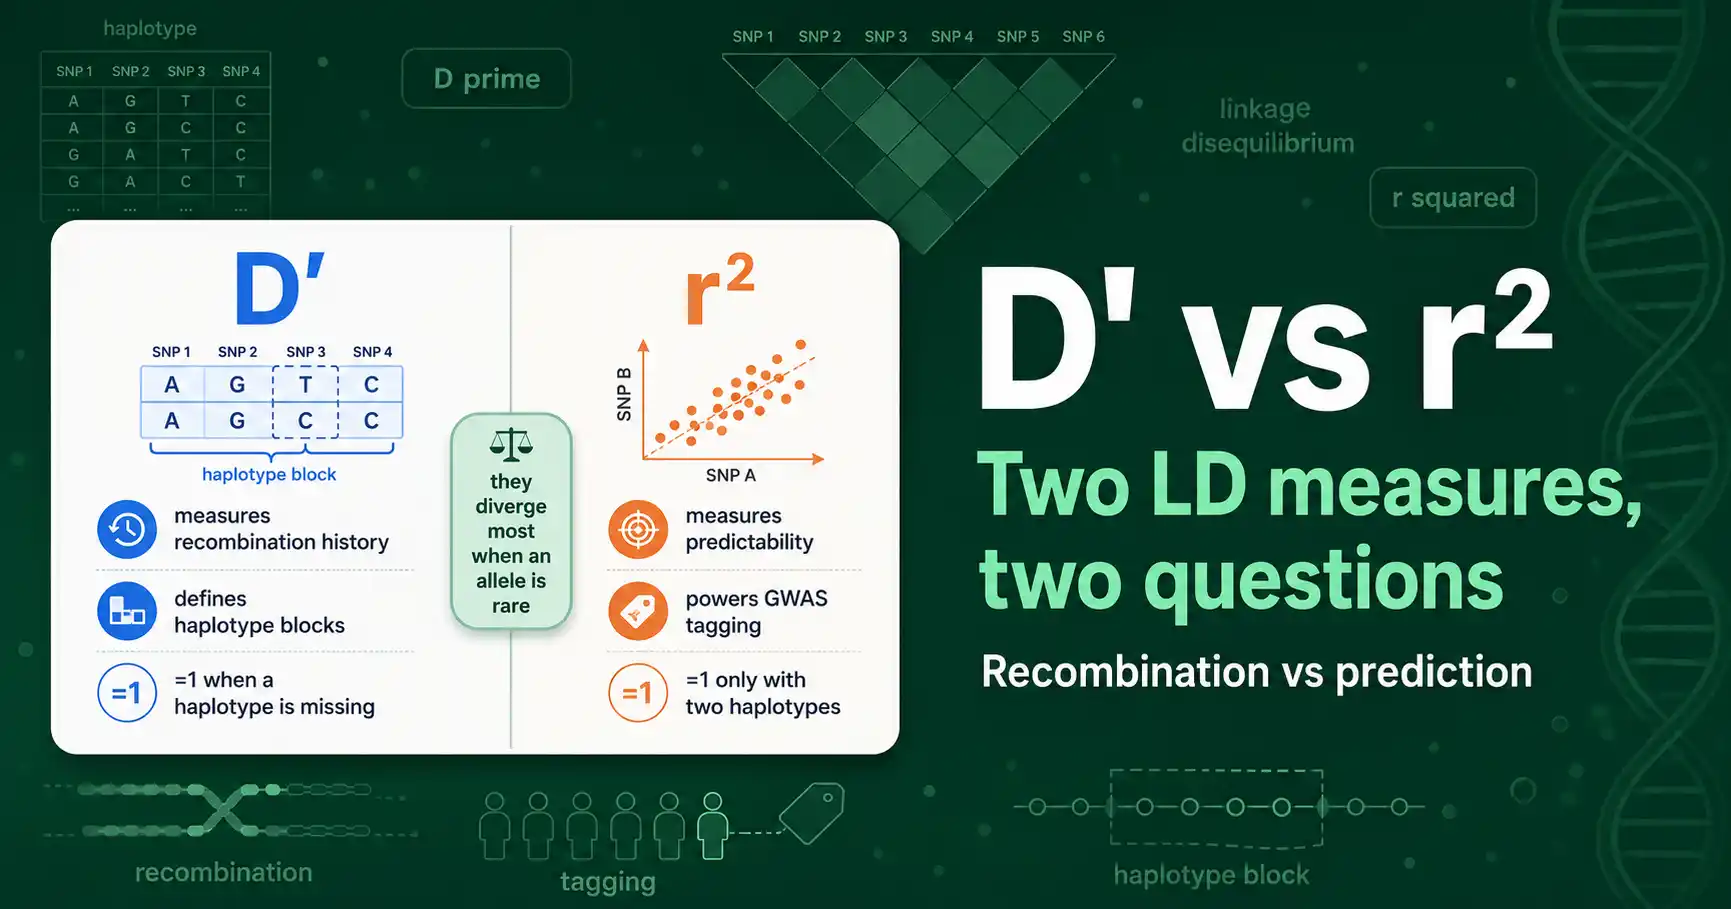
D' and r² both measure linkage disequilibrium but answer different questions. Use D' for recombination and haplotype blocks, r² for prediction and GWAS tagging. Here is why.
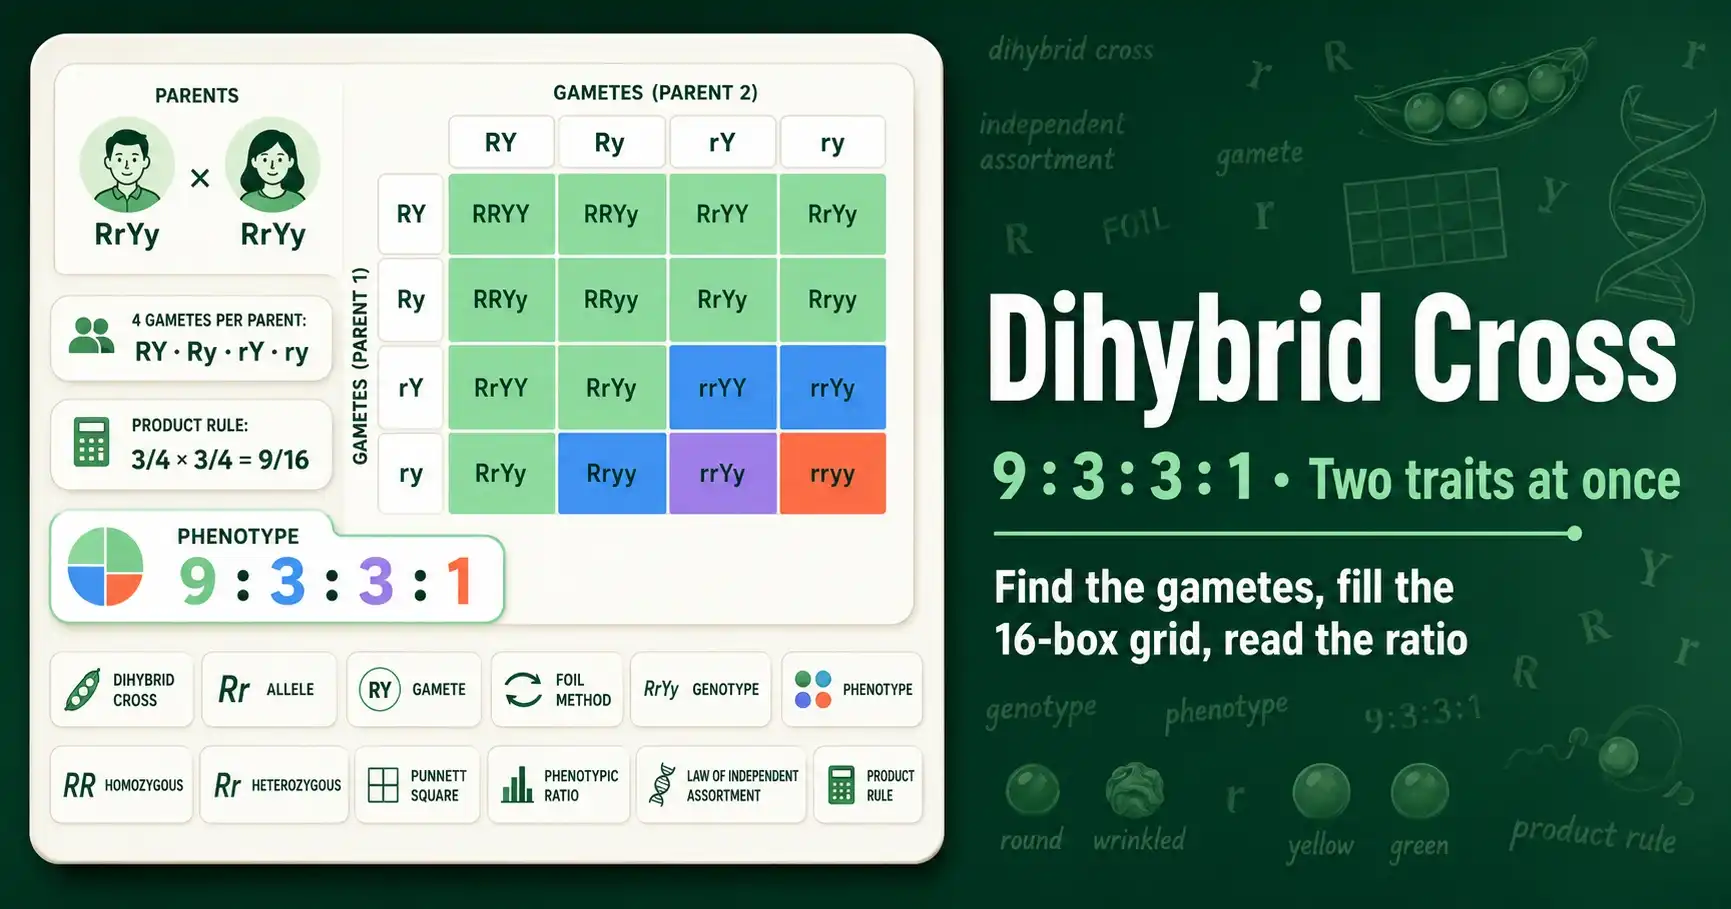
A dihybrid cross gives a 9:3:3:1 phenotype ratio. Learn how to find the four gametes, fill the 16-box grid, and use the product rule, with worked pea examples.
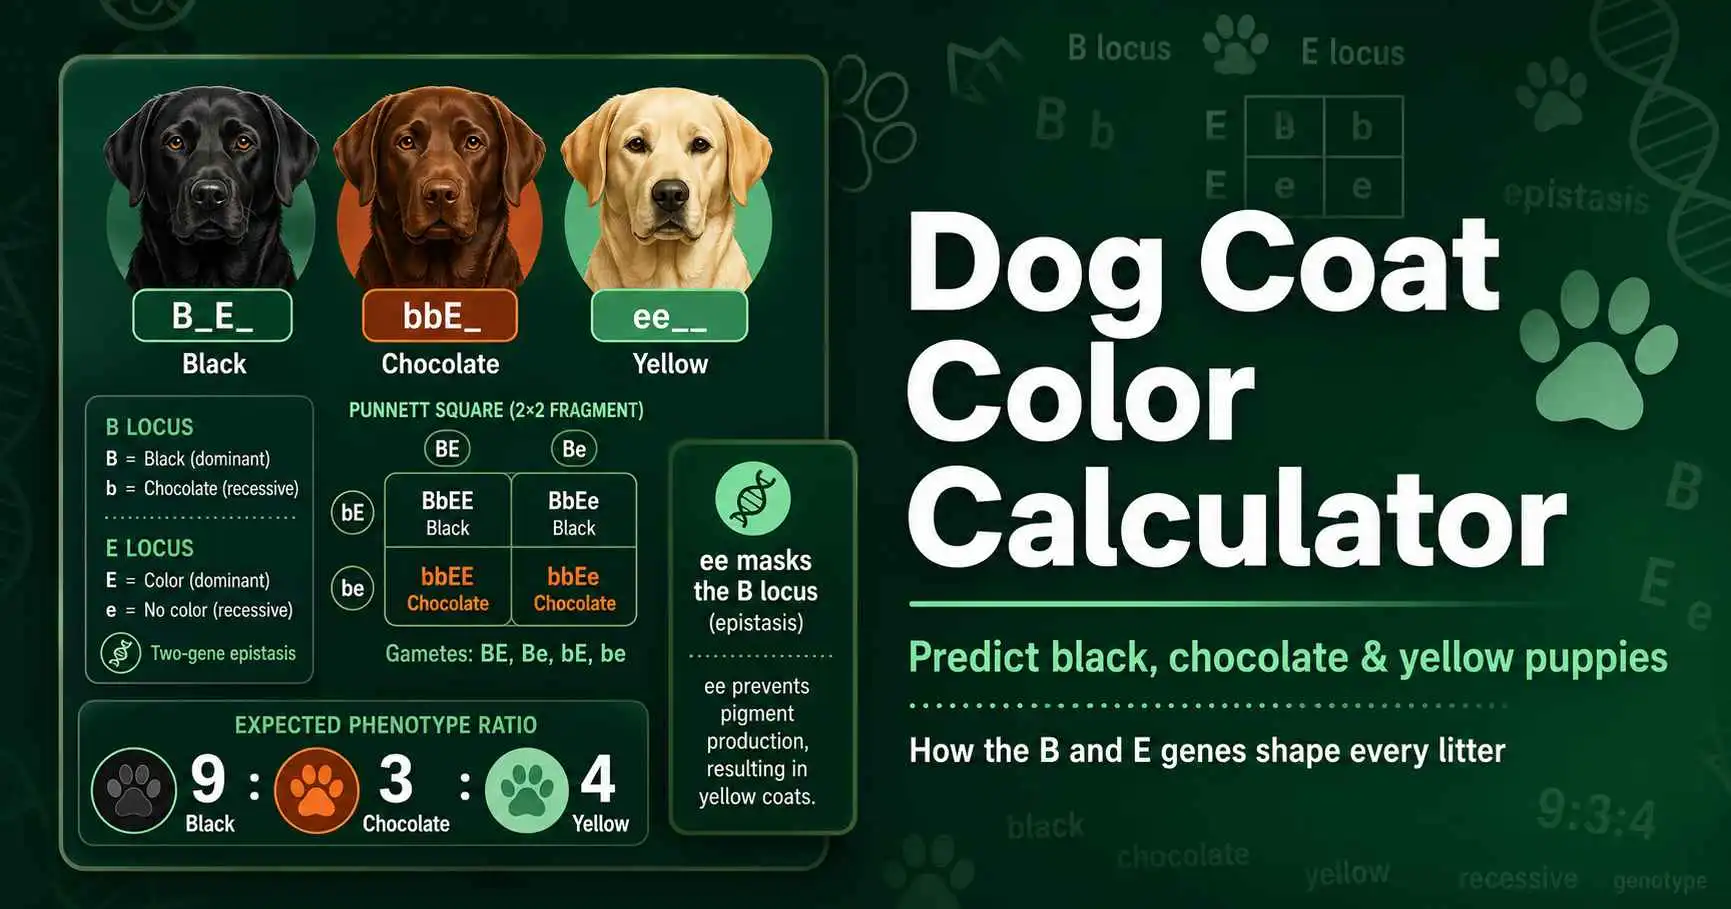
Learn how dog coat color genetics works and predict puppy colors with a Punnett square. Covers the B and E loci, black, chocolate, and yellow Labradors, and epistasis.

Effective population size (Ne) is the size of an ideal population that drifts at the same rate as a real one. Learn the formulas, the Ne/N ratio, and the 50/500 rule with data.
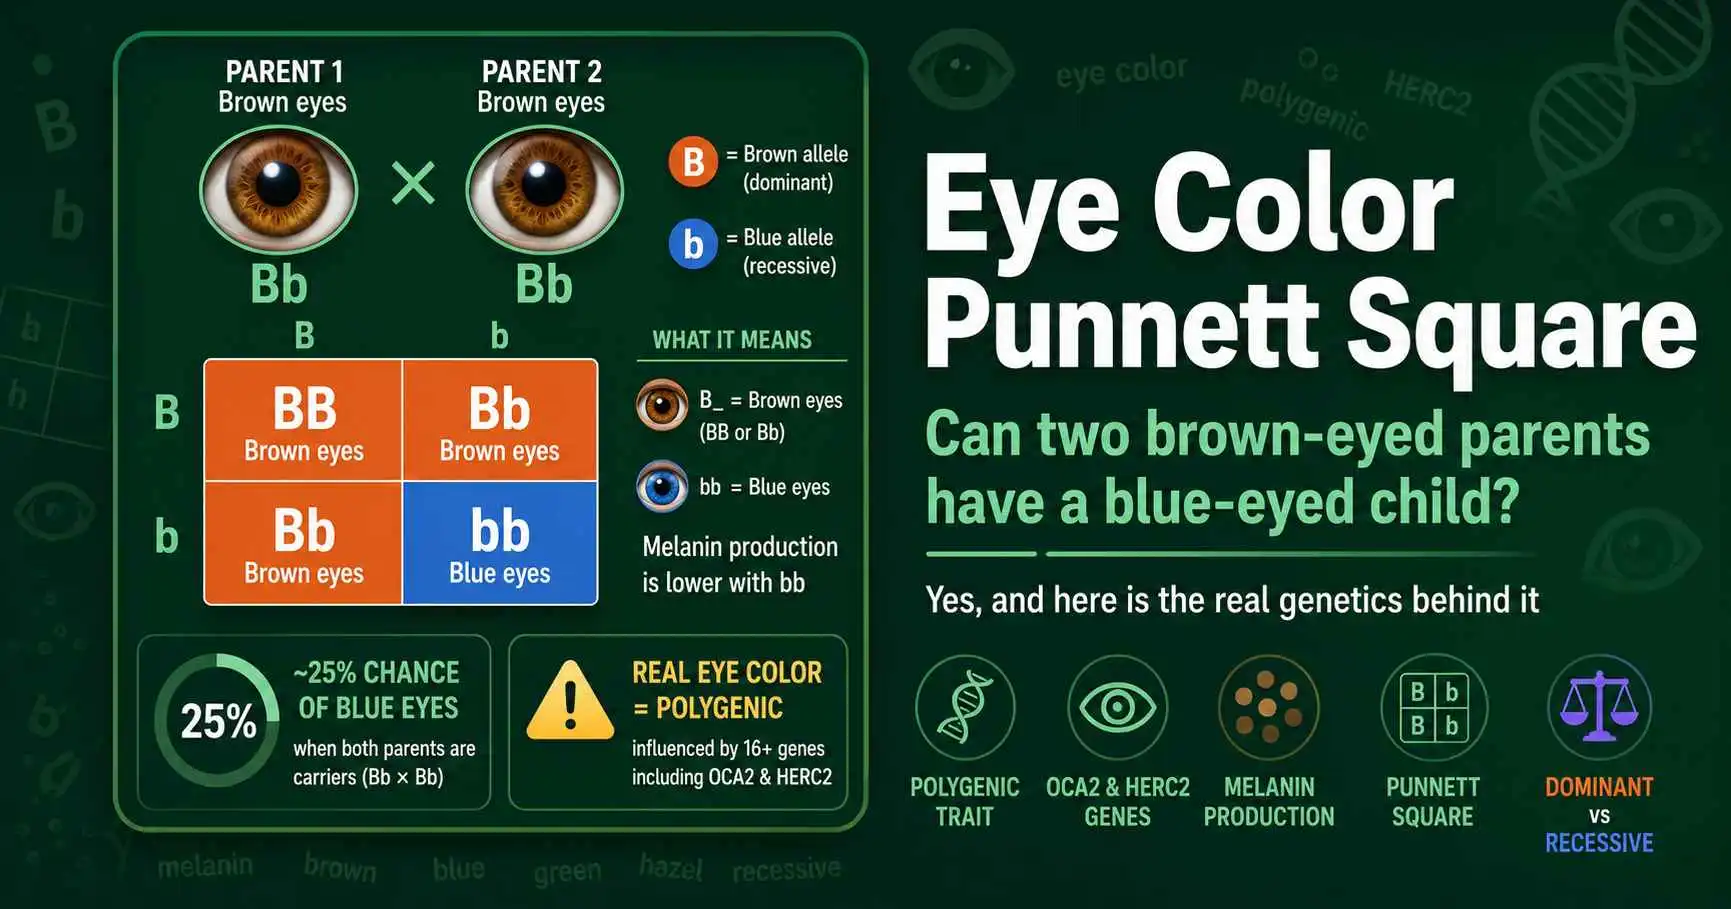
Can two brown-eyed parents have a blue-eyed child? Yes. Learn how eye color genetics really works, why the simple Punnett square model is wrong, and how to use it anyway.
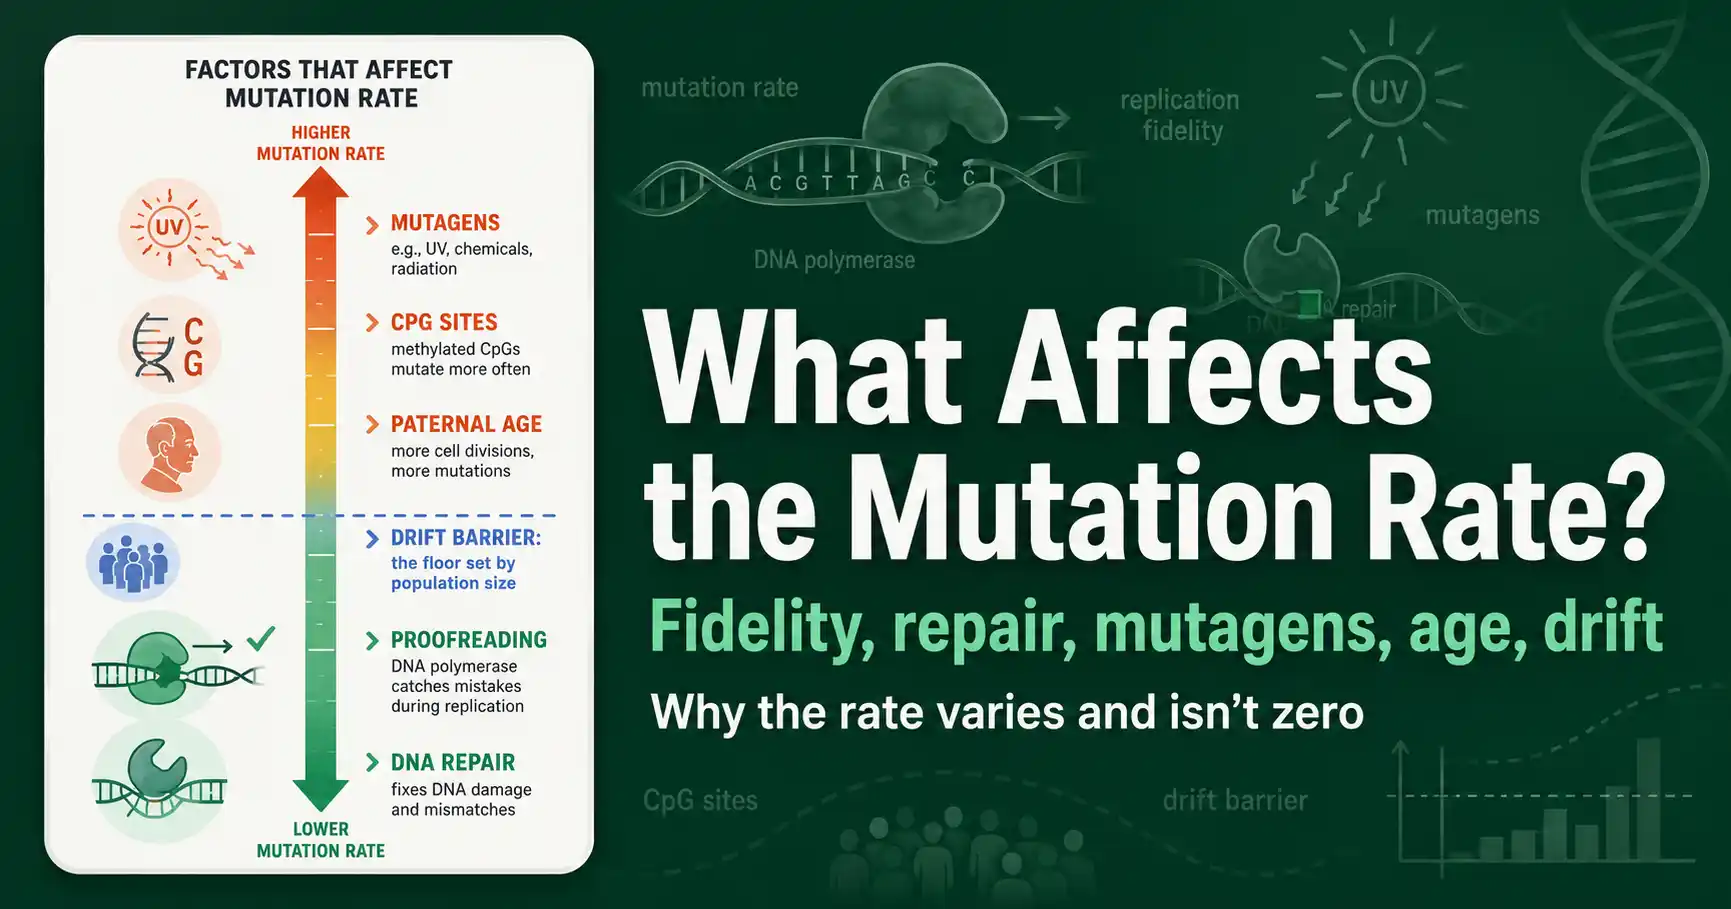
The mutation rate is shaped by DNA replication fidelity, repair systems, mutagens, sequence context like CpG sites, parental age, and the drift-barrier set by population size.
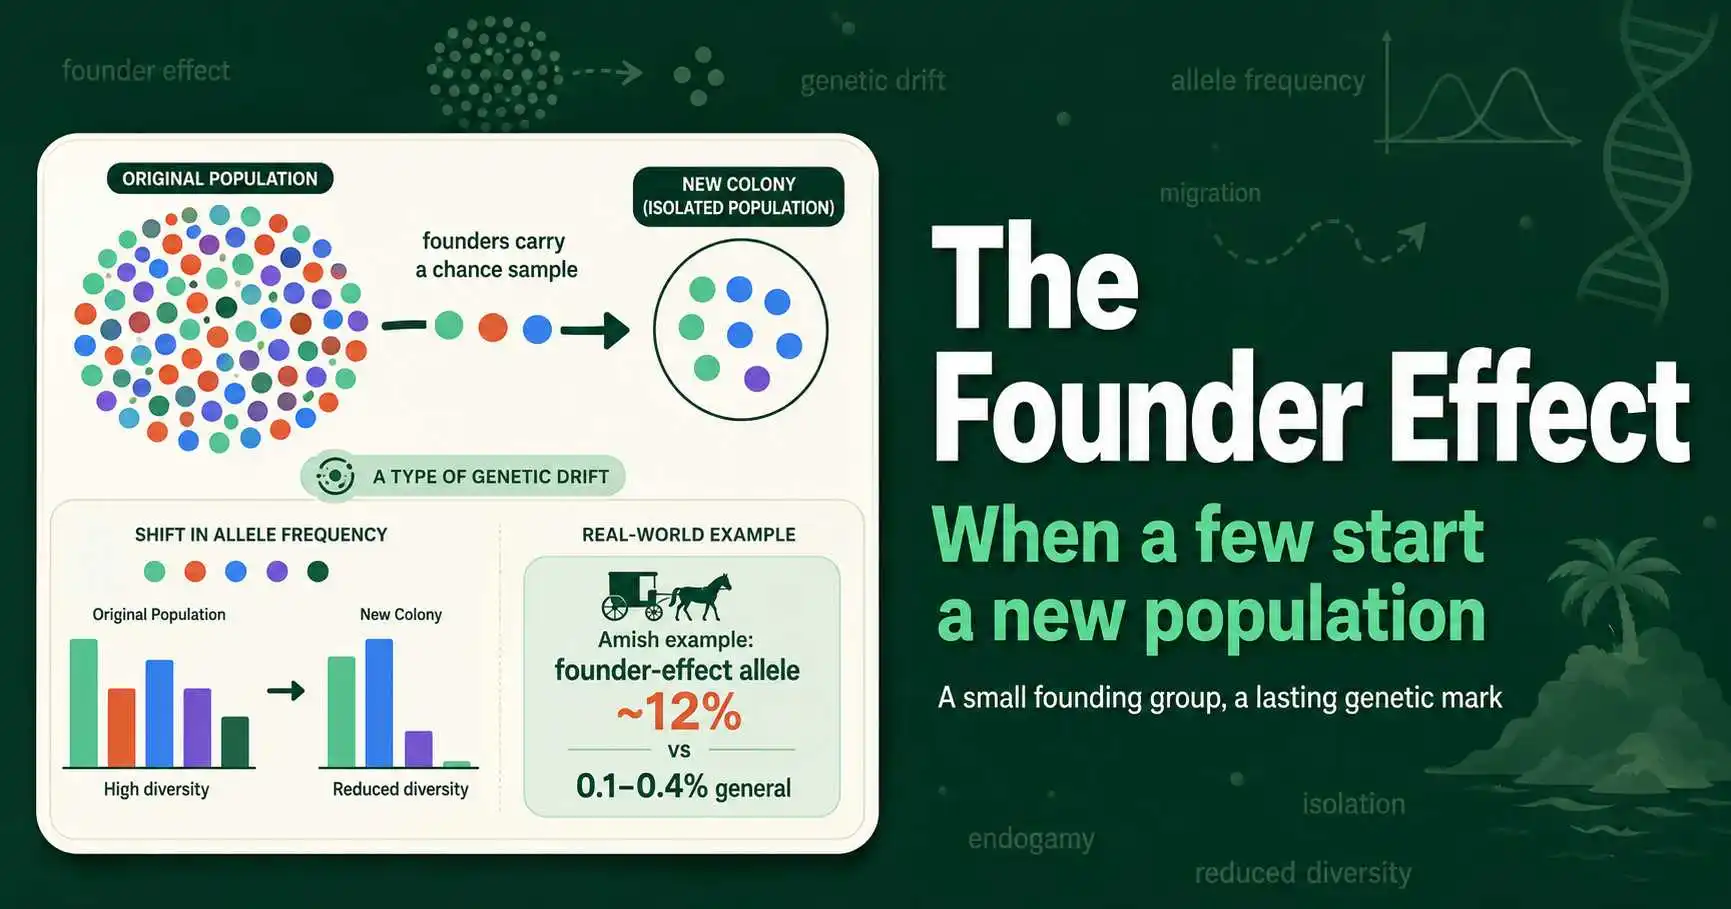
The founder effect is the loss of genetic variation when a few individuals start a new population. Learn its causes, real examples like the Amish, and how it differs from a bottleneck.
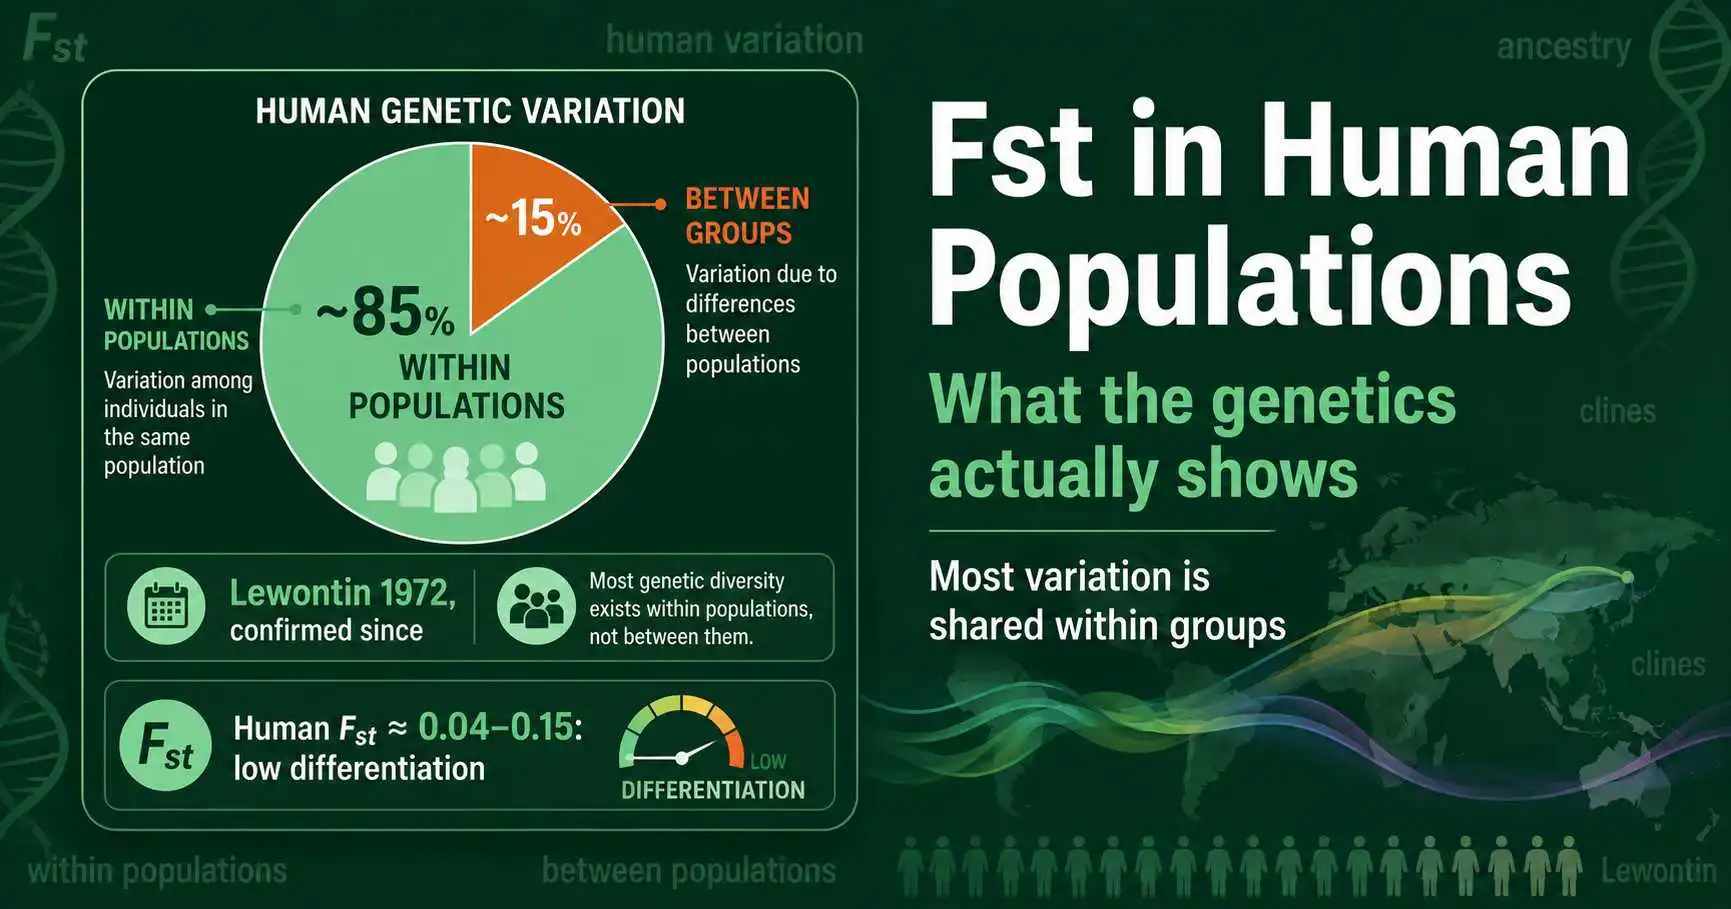
What Fst reveals about human genetic variation: the 85% within-populations finding, continental Fst values, ancestry, clines, and what the science does and does not support.

What is a high or low Fst value? See Wright's benchmark bands, real Fst figures for humans and other species, and why the same number can mean different things.
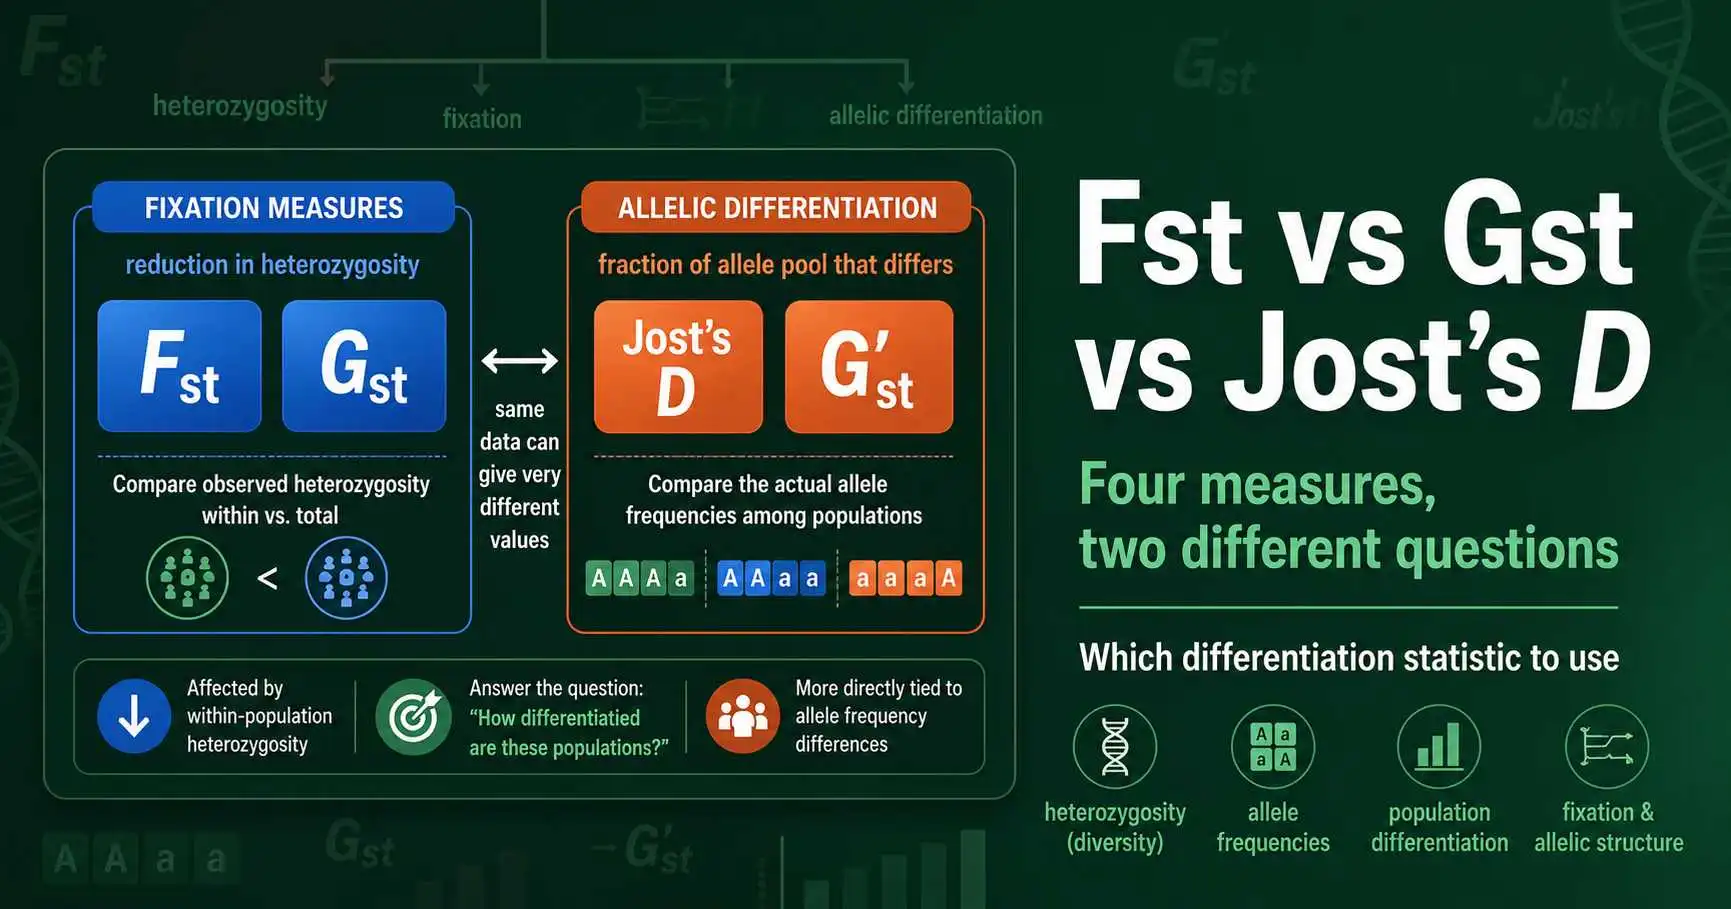
Fst, Gst, Hedrick's G'st, and Jost's D all measure population differentiation differently. Here is what each one captures, when they disagree, and which to use.
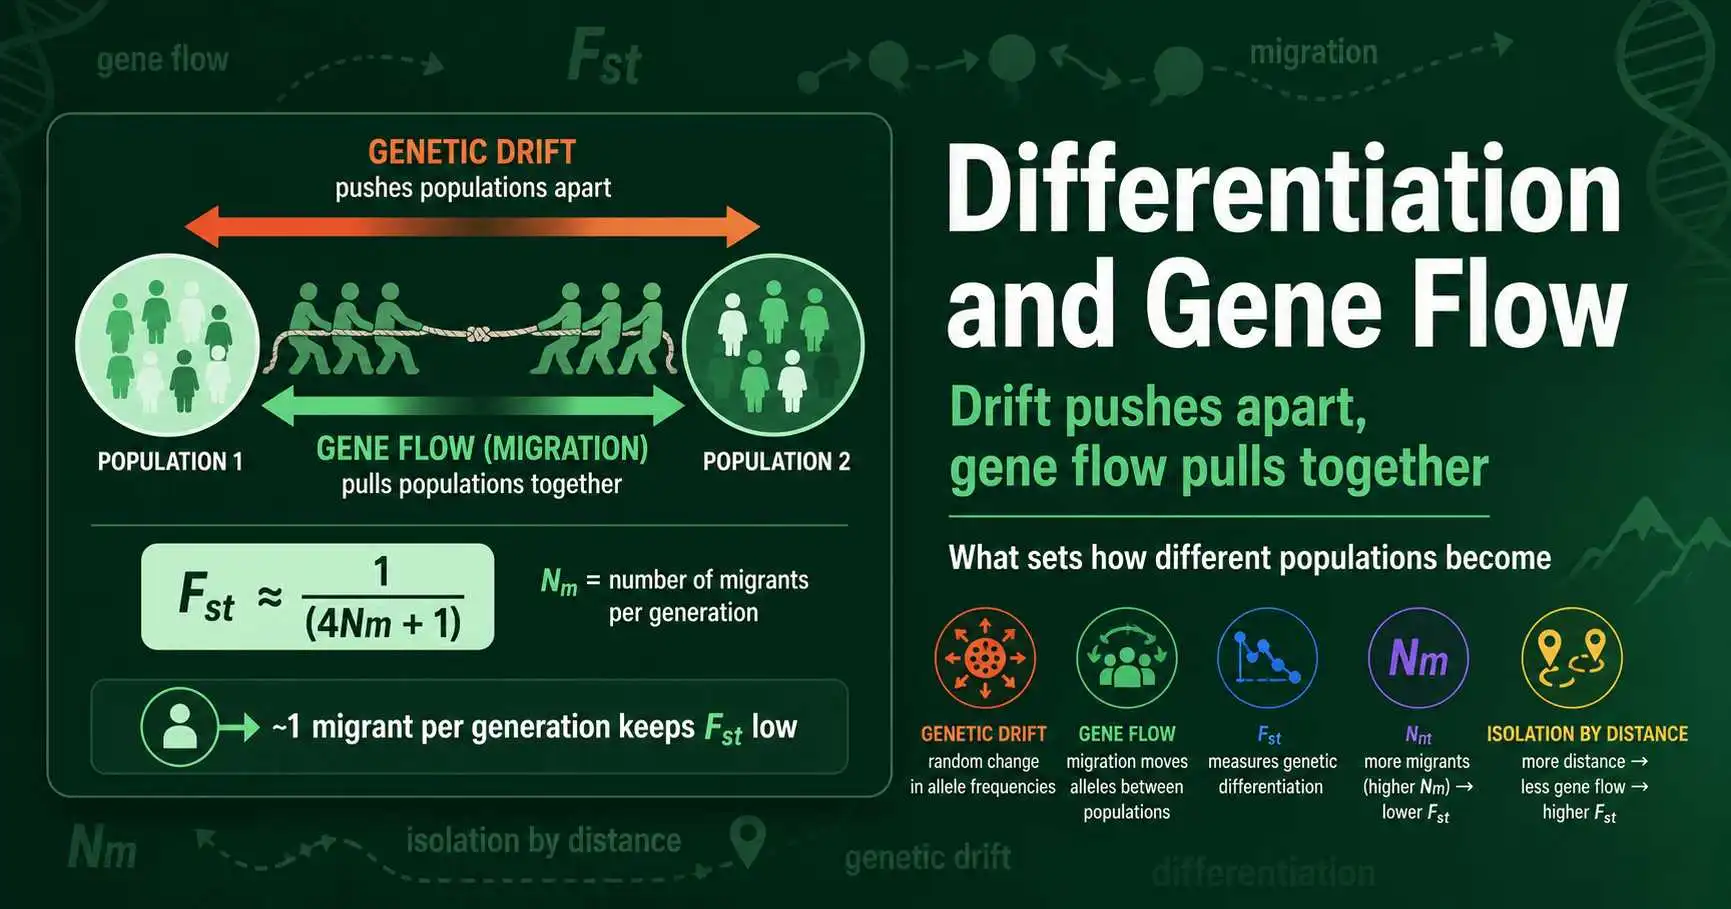
Gene flow and genetic drift pull in opposite directions to set how differentiated populations become. Learn the Fst-migration link, isolation by distance, and what it reveals.

Genetic drift threatens small populations through lost diversity, inbreeding, and the extinction vortex. See how conservation fights back, with the Florida panther data.

Graded genetic drift practice problems with full worked answers: fixation probability, heterozygosity loss, effective population size, founder effect, and drift versus selection.
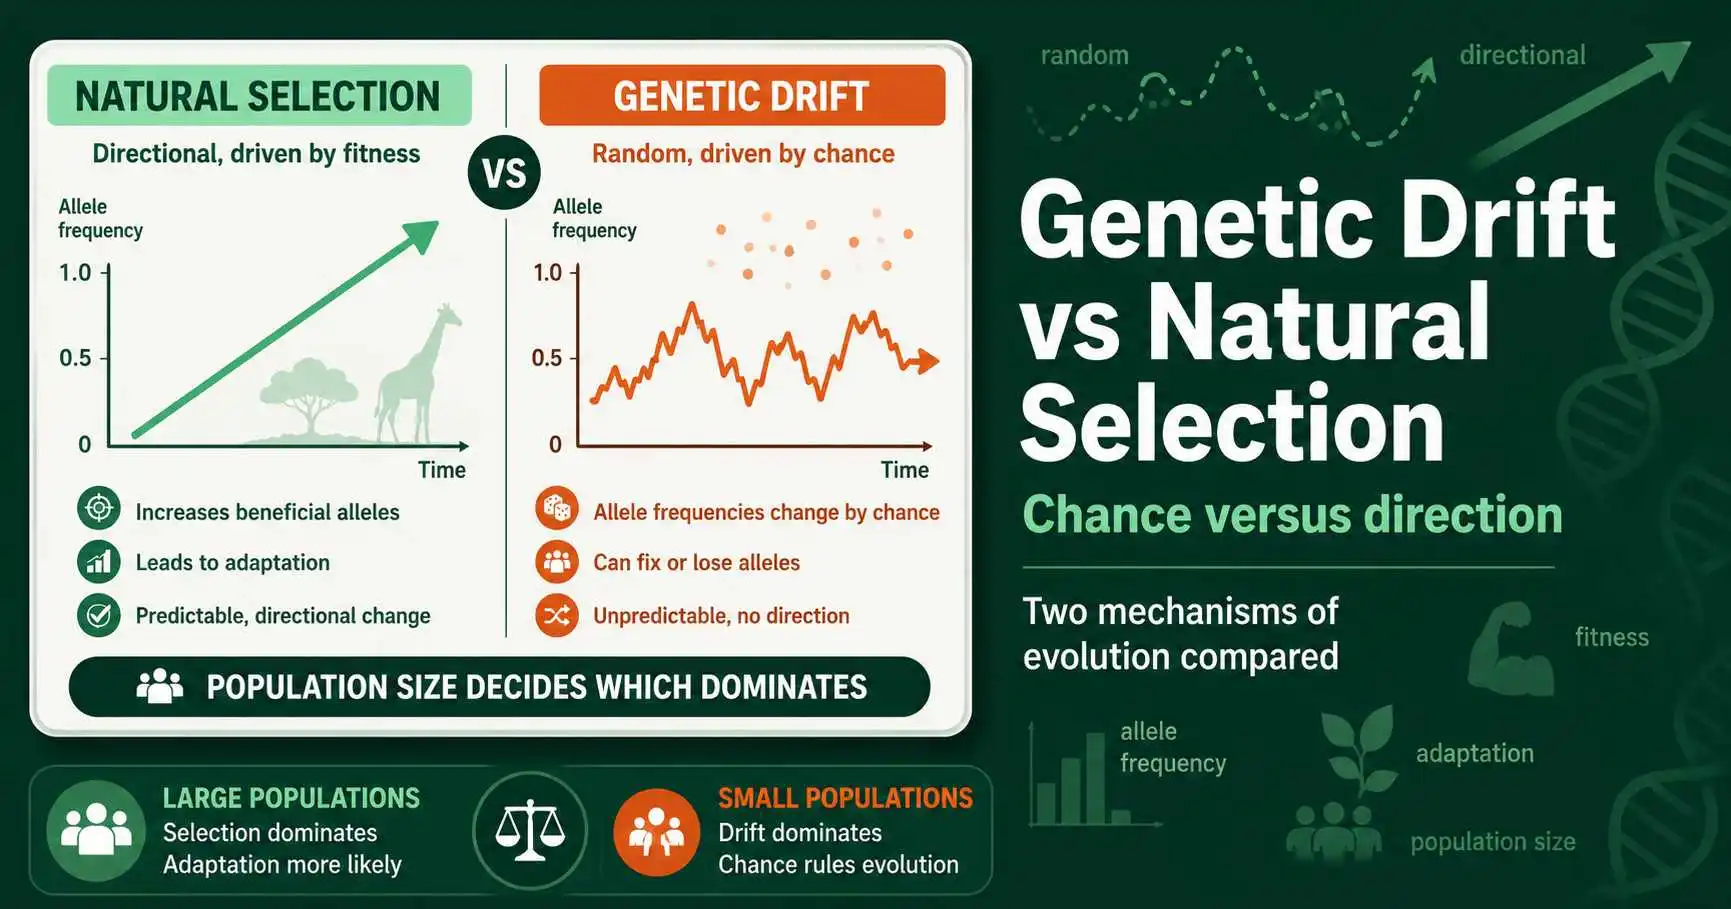
Genetic drift vs natural selection compared: random vs directional, fitness vs chance, and population size effects, with a clear table, real examples, and data.
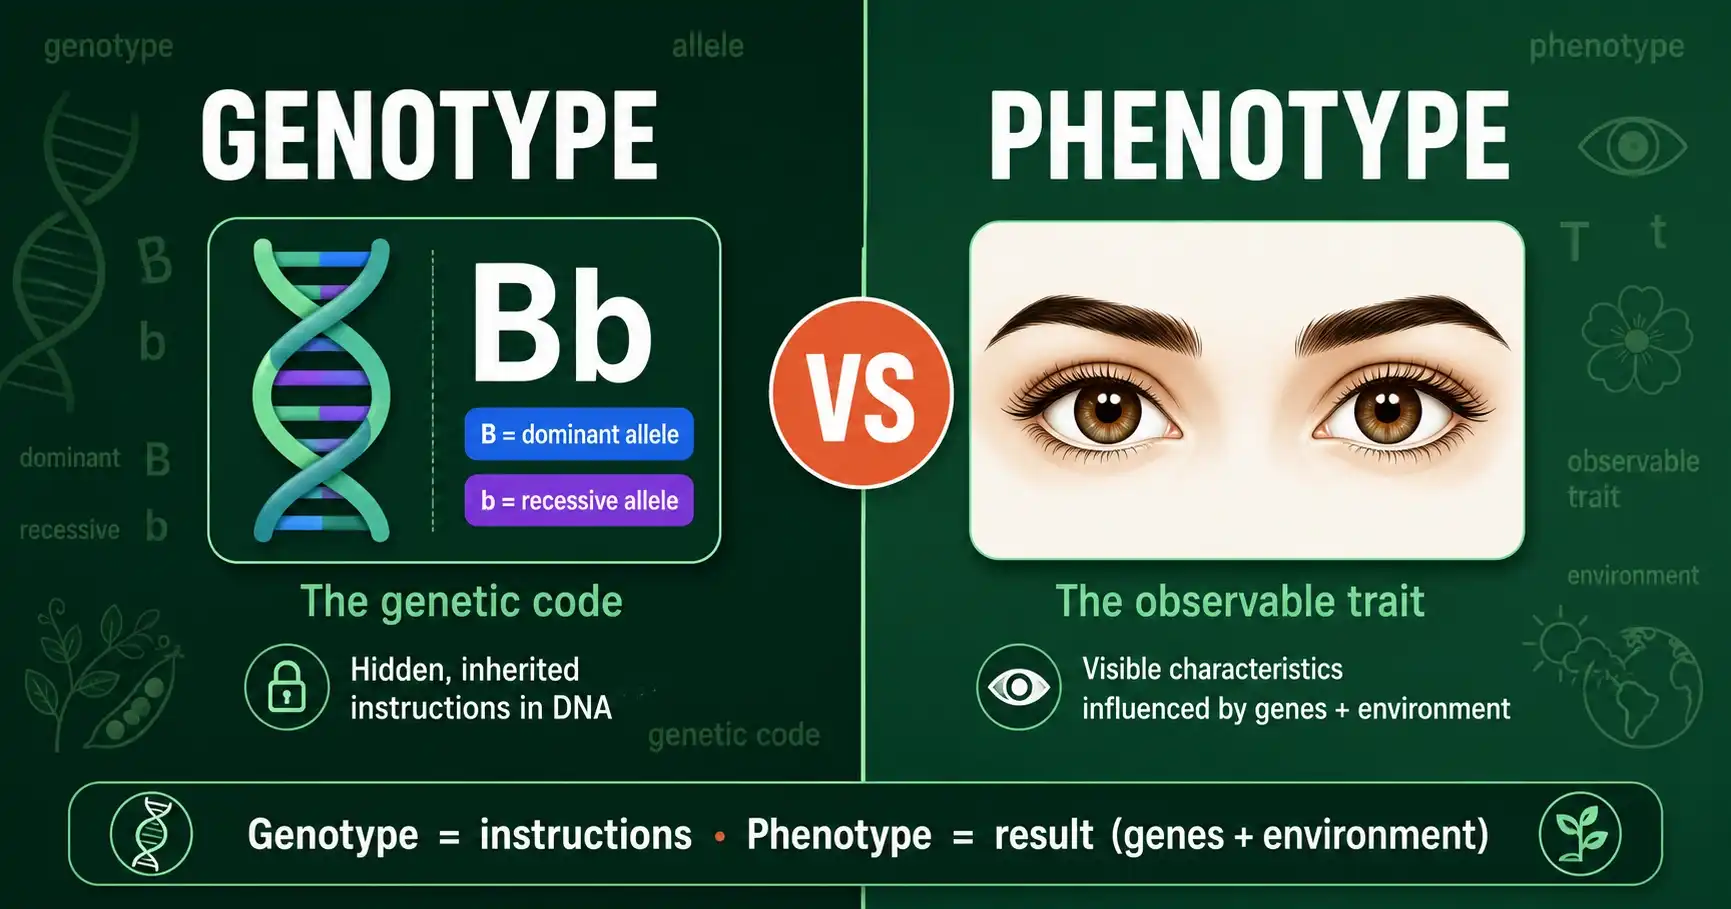
Genotype is an organism's genetic code; phenotype is its observable traits. Learn how they differ, how genes shape traits, and why the same genotype can vary.
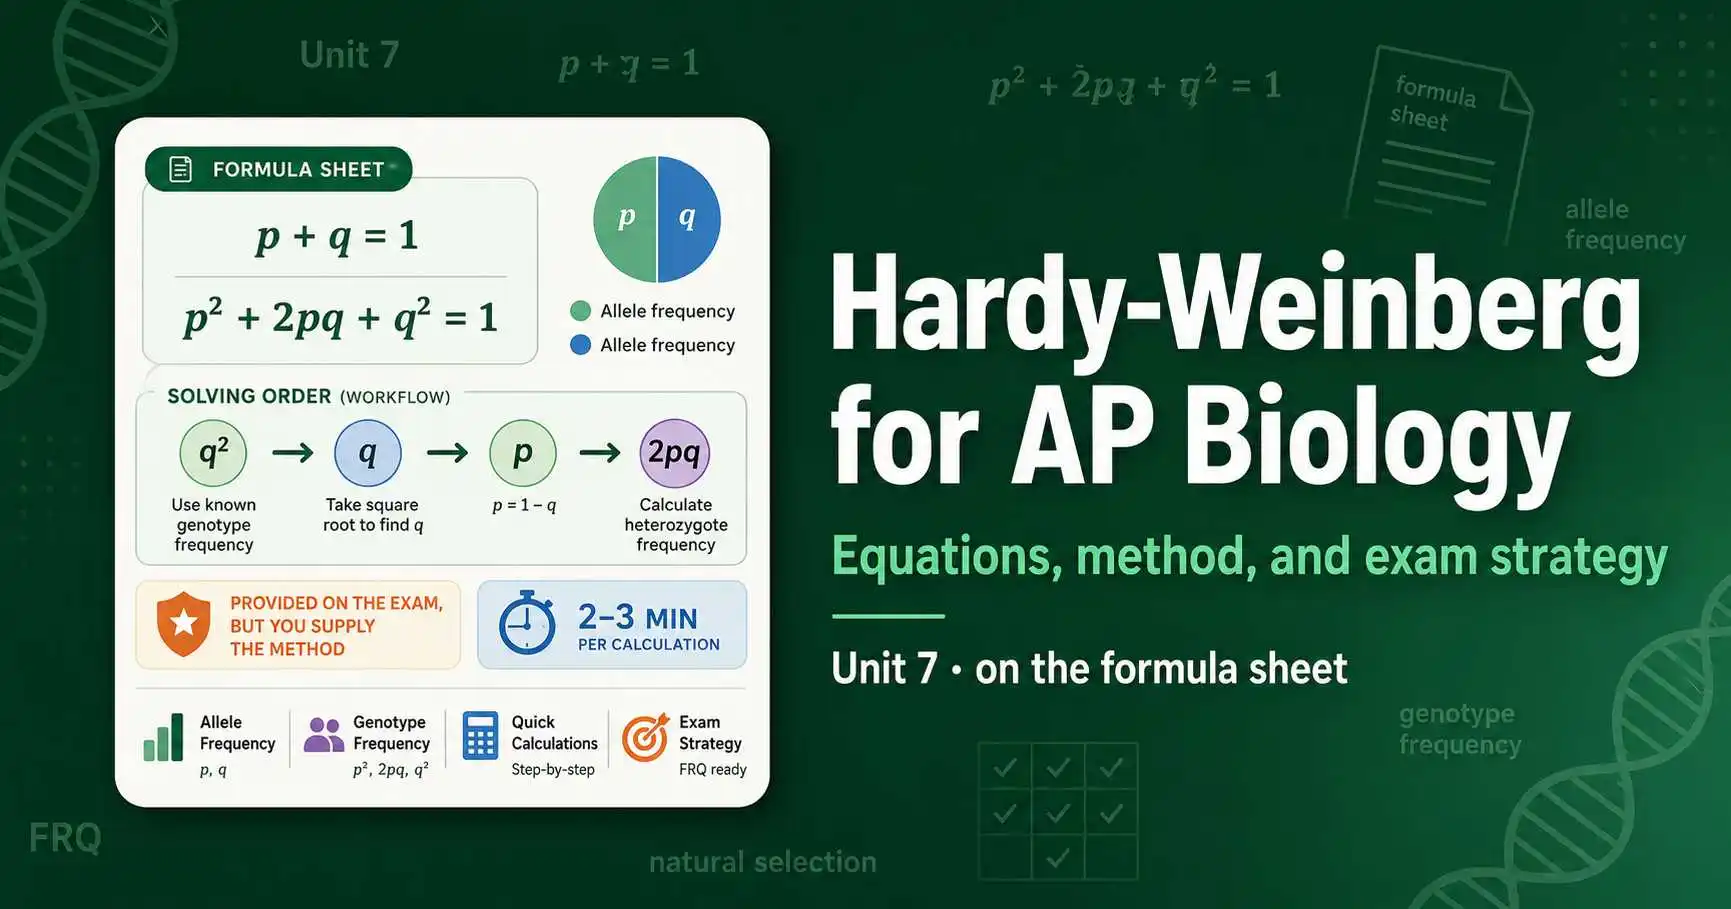
Hardy-Weinberg for AP Biology: the equations on the formula sheet, how to solve FRQ and MCQ problems, the five conditions, common mistakes, and exam strategy.
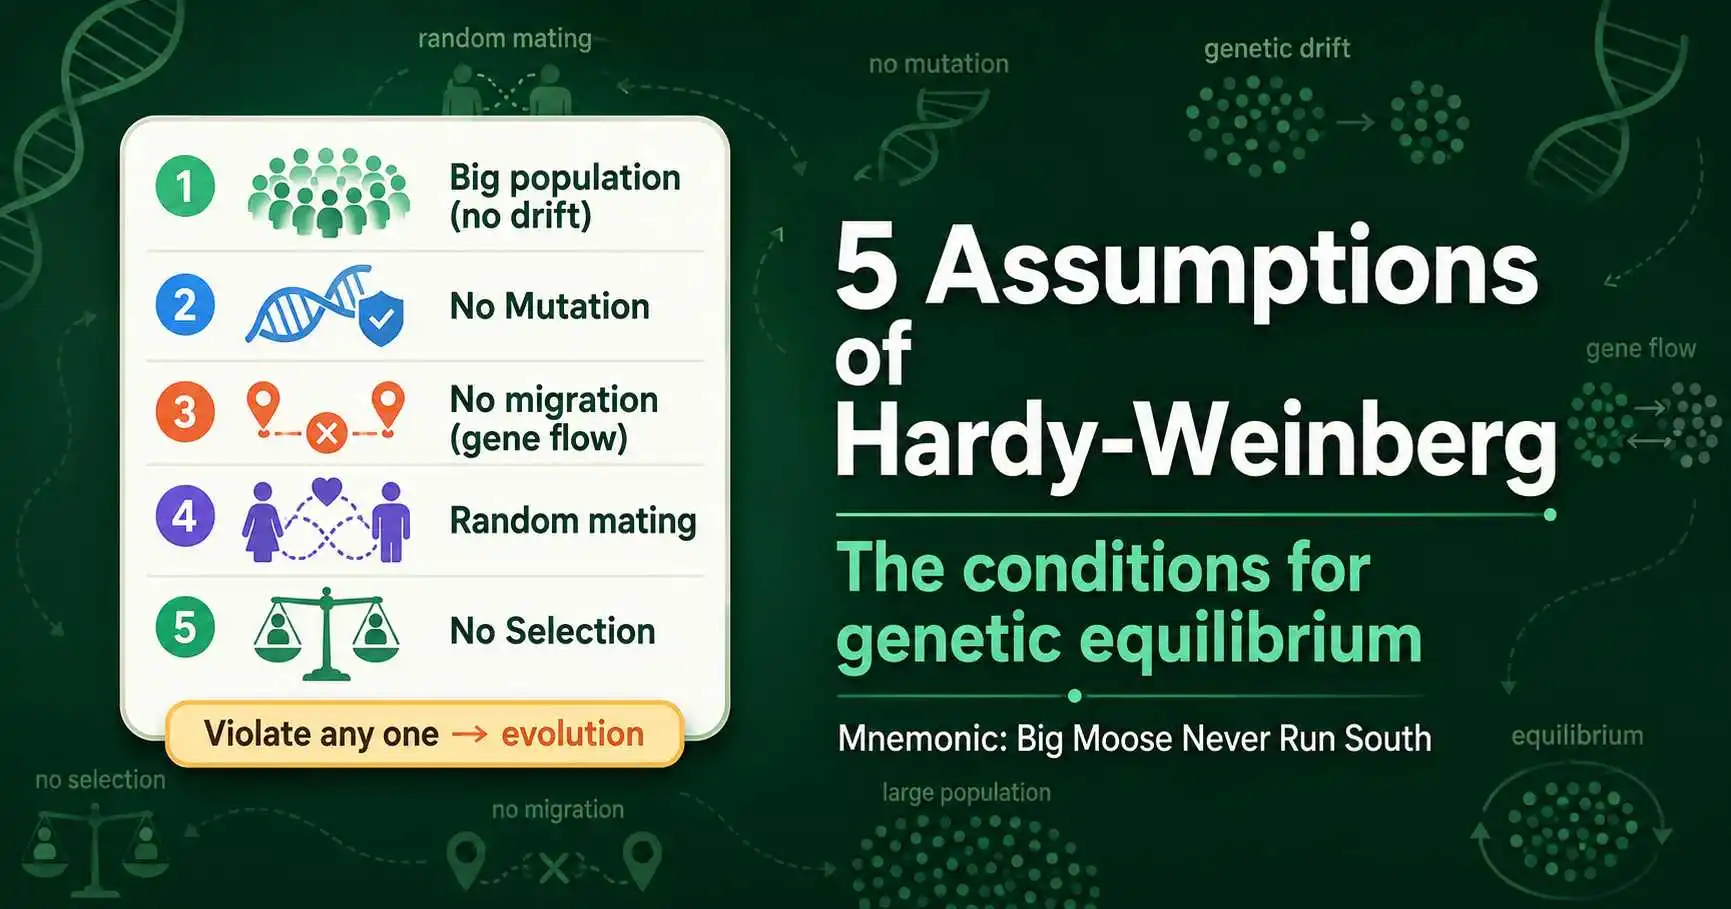
The five assumptions of Hardy-Weinberg equilibrium explained: large population, random mating, no mutation, no migration, no selection, and what violating each one does.
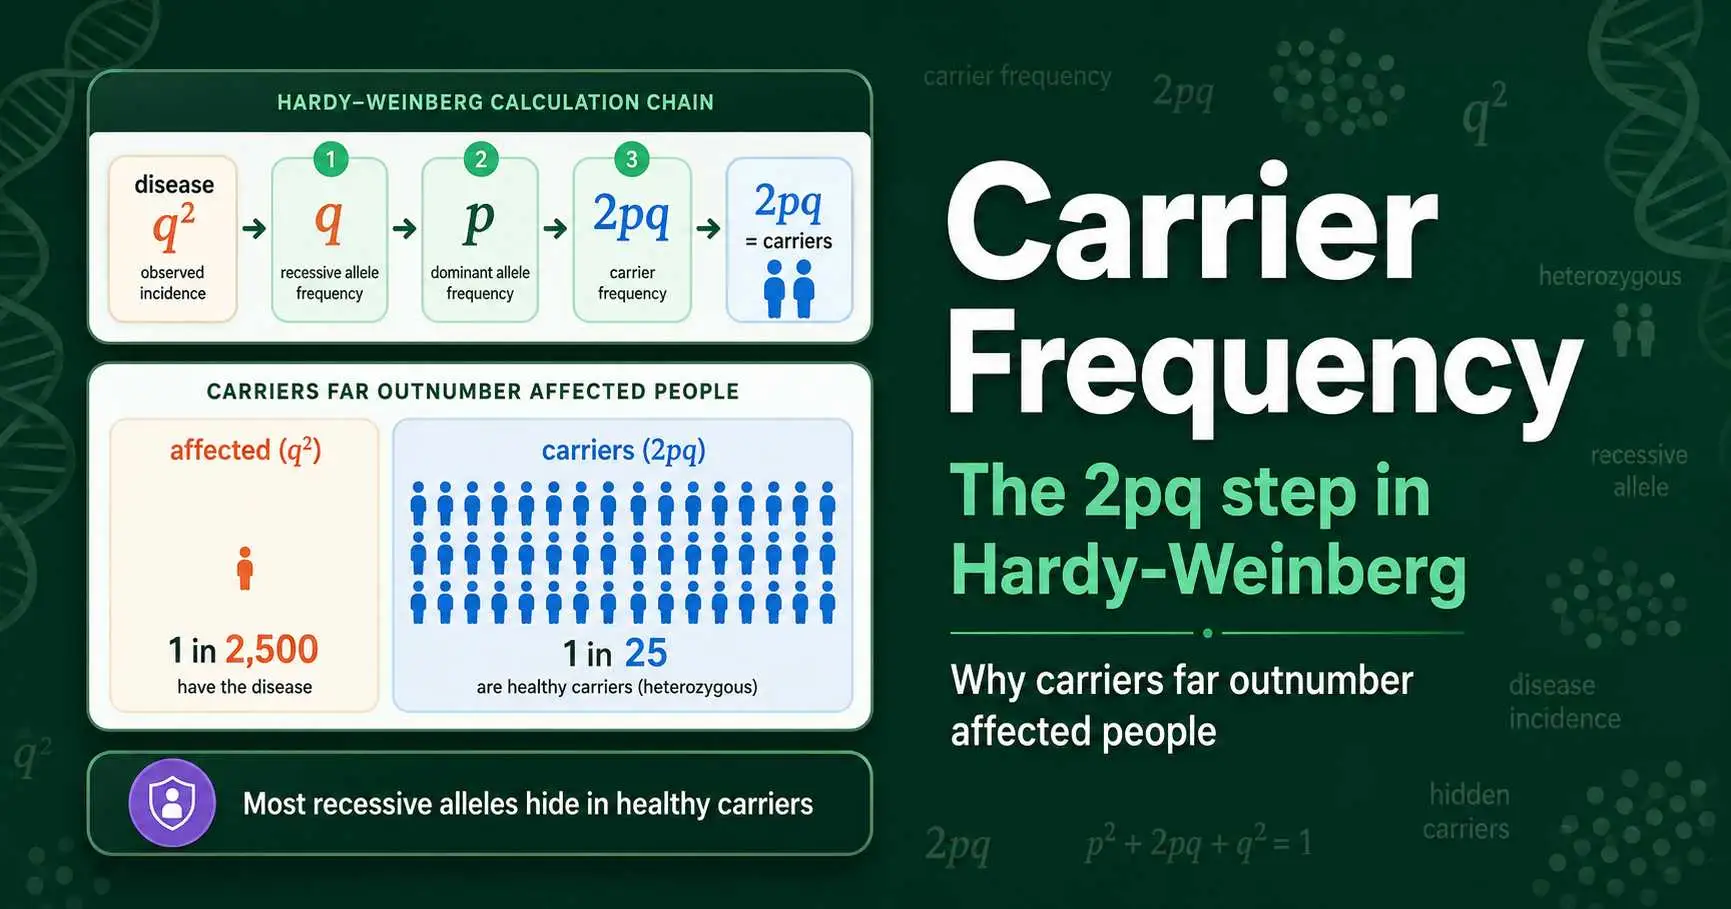
How to calculate carrier frequency with Hardy-Weinberg. The 2pq step explained, why carriers outnumber affected people, and worked examples for CF, PKU, and sickle cell.
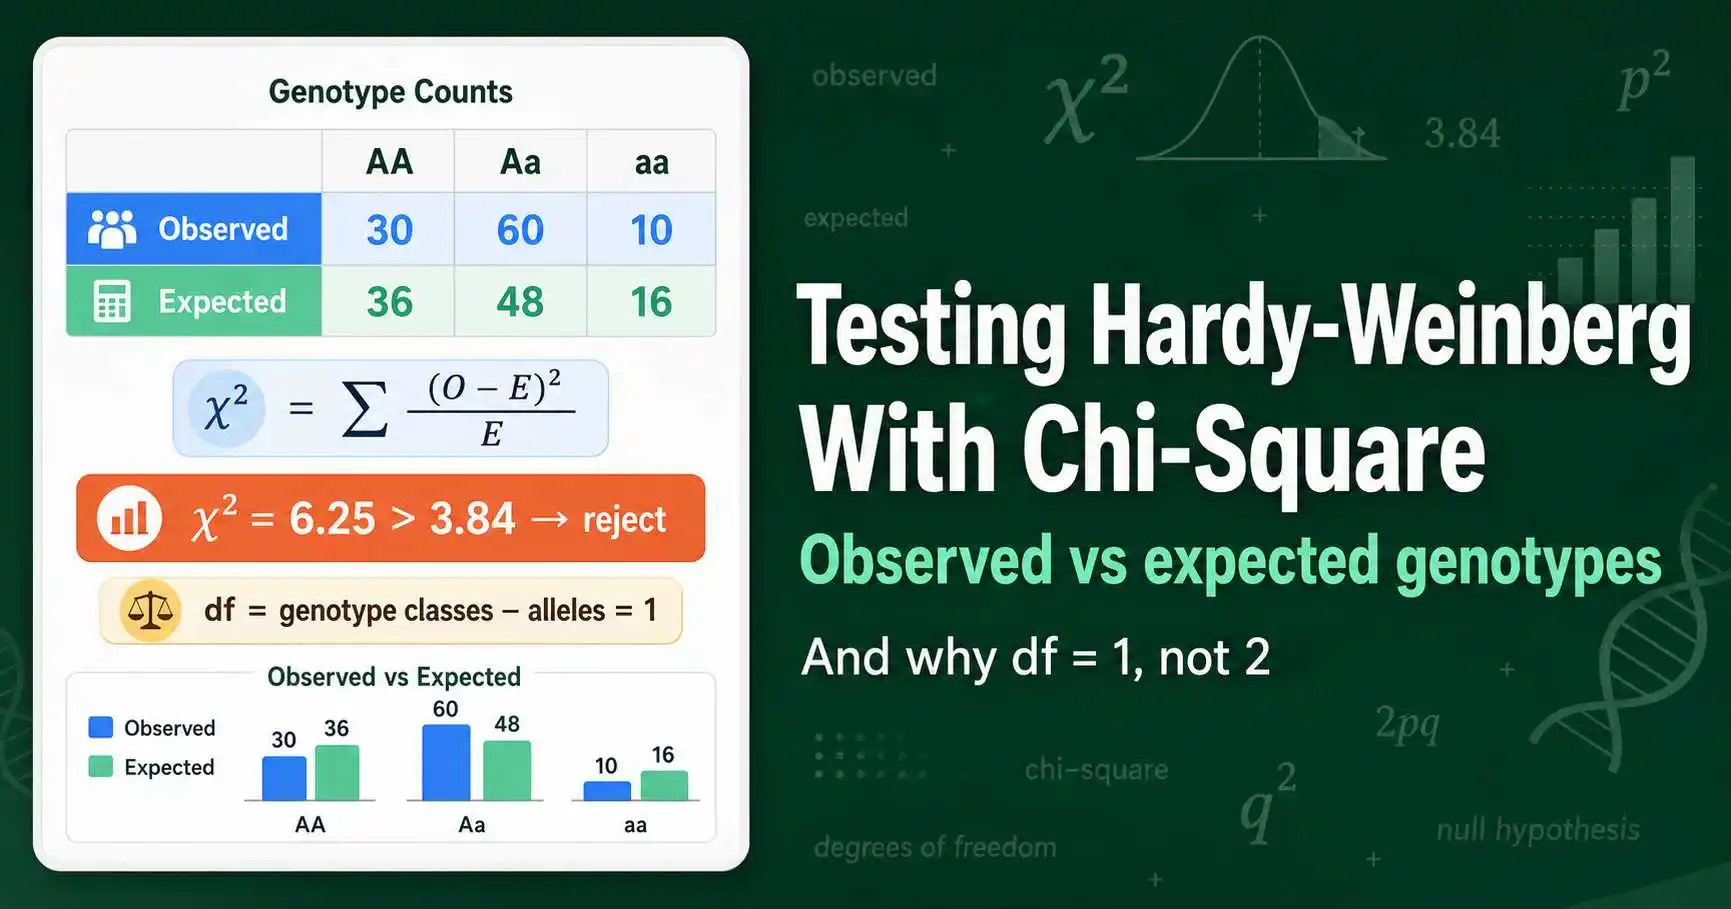
How to test for Hardy-Weinberg equilibrium with a chi-square test: calculating expected counts, the chi-square statistic, and why degrees of freedom is 1, not 2.
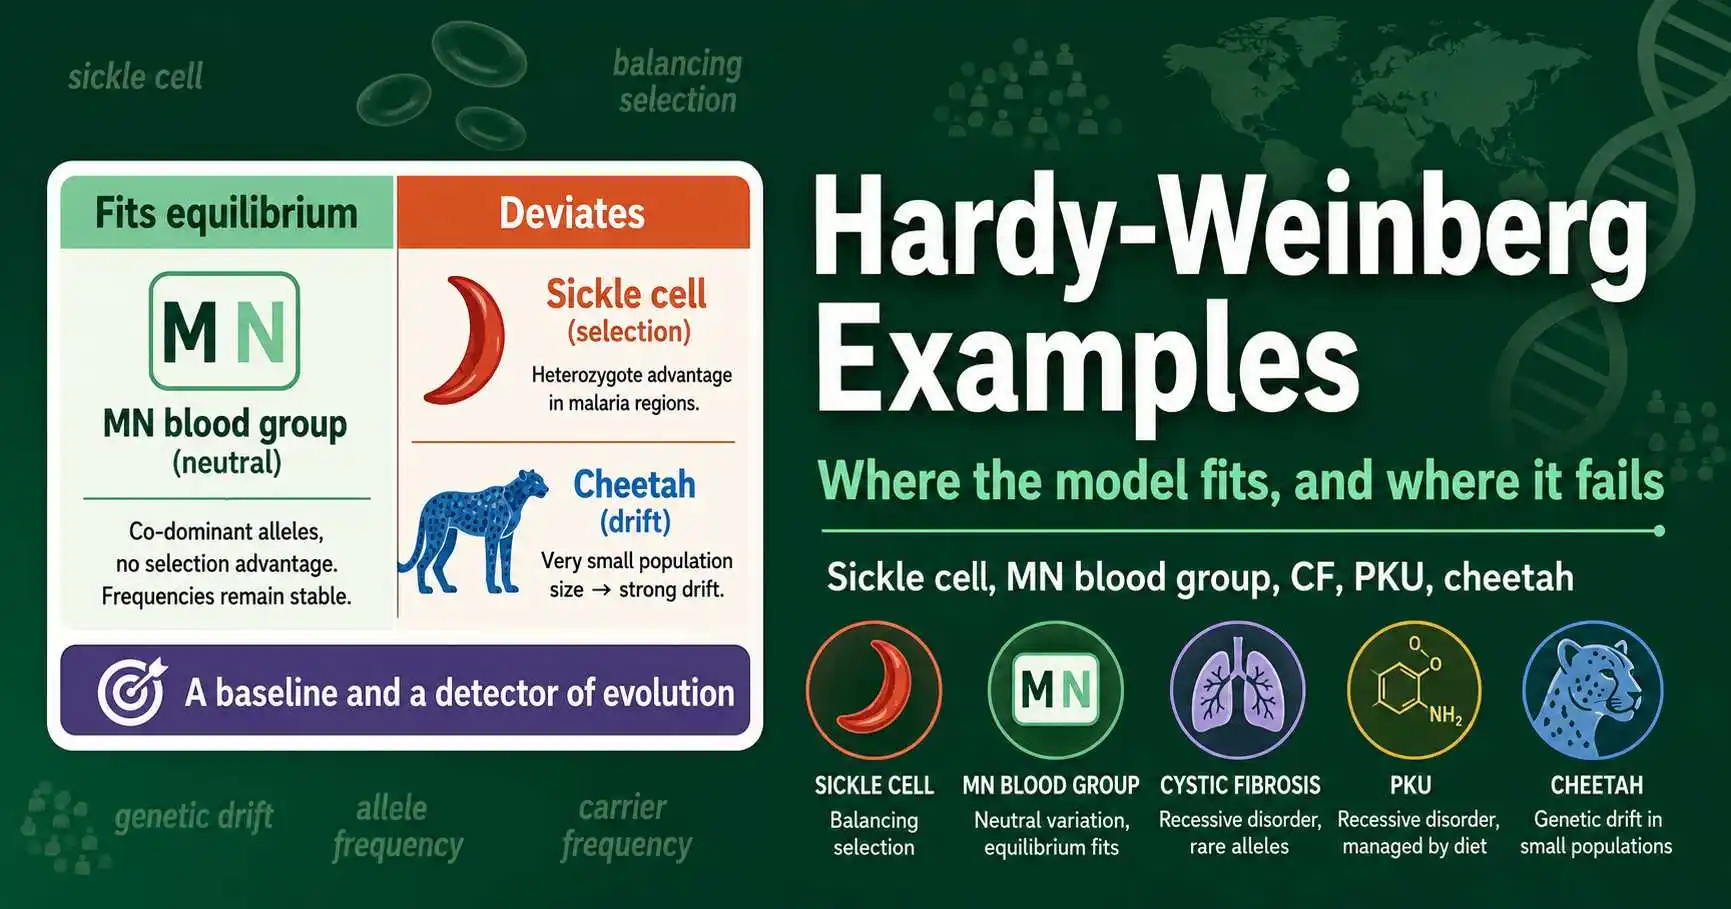
Real Hardy-Weinberg equilibrium examples: sickle cell and malaria, cystic fibrosis, PKU, the MN blood group, and the cheetah bottleneck, showing where the model fits and fails.
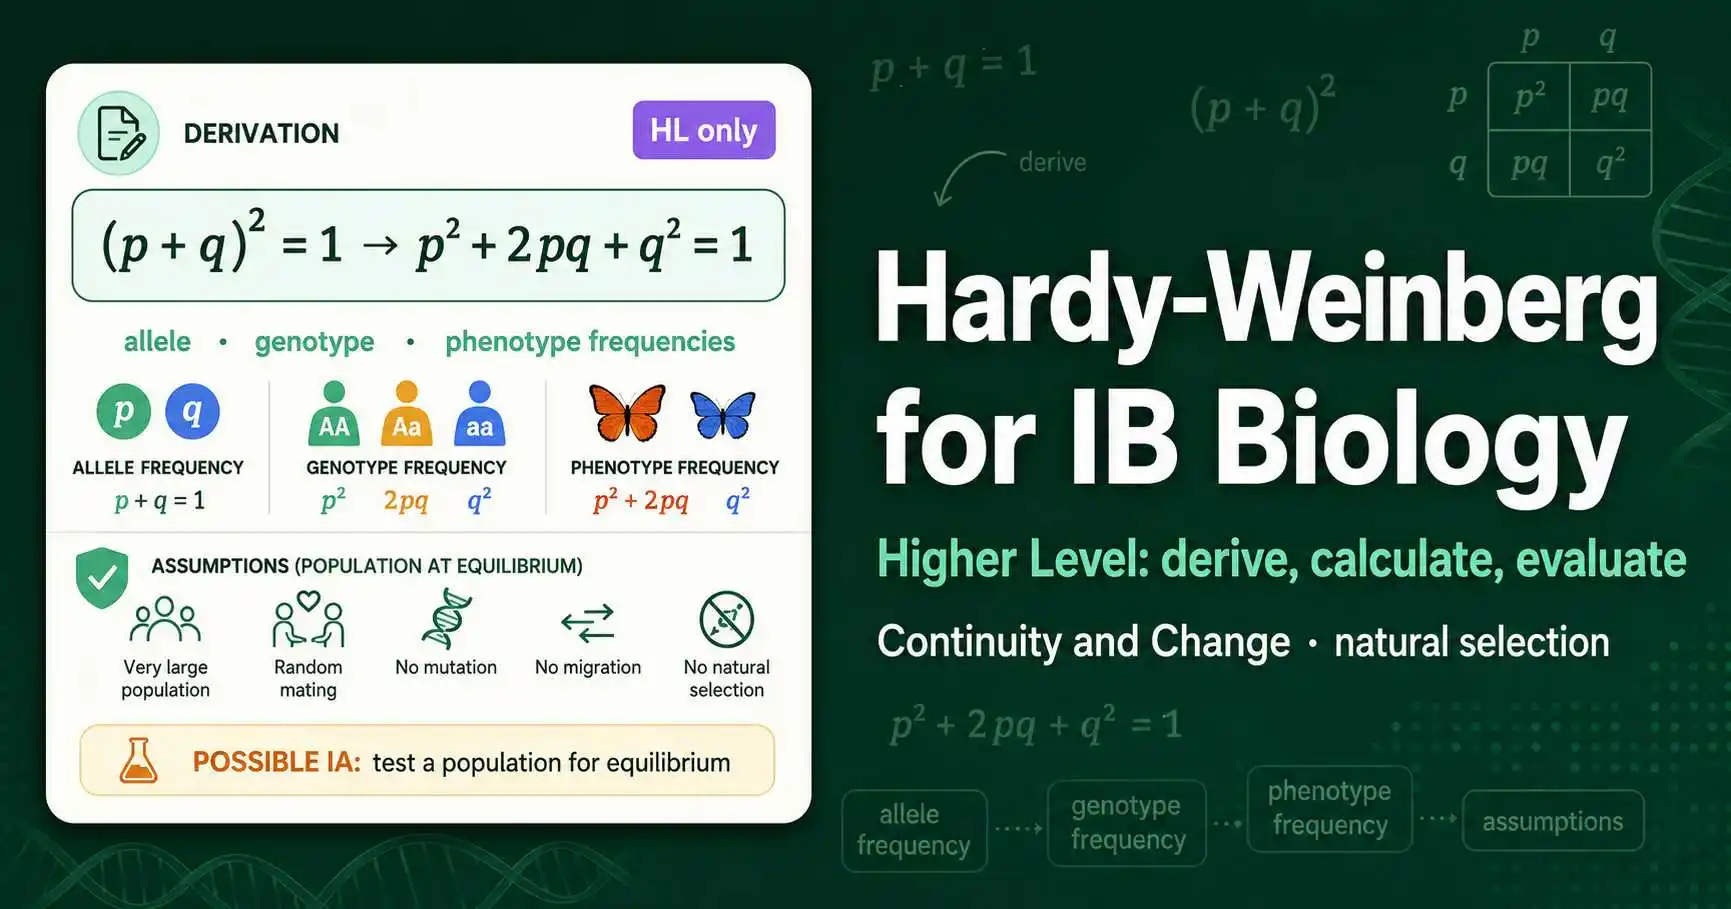
Hardy-Weinberg for IB Biology HL: deriving the equation, calculating allele, genotype and phenotype frequencies, the assumptions, and how it appears in exams and the IA.
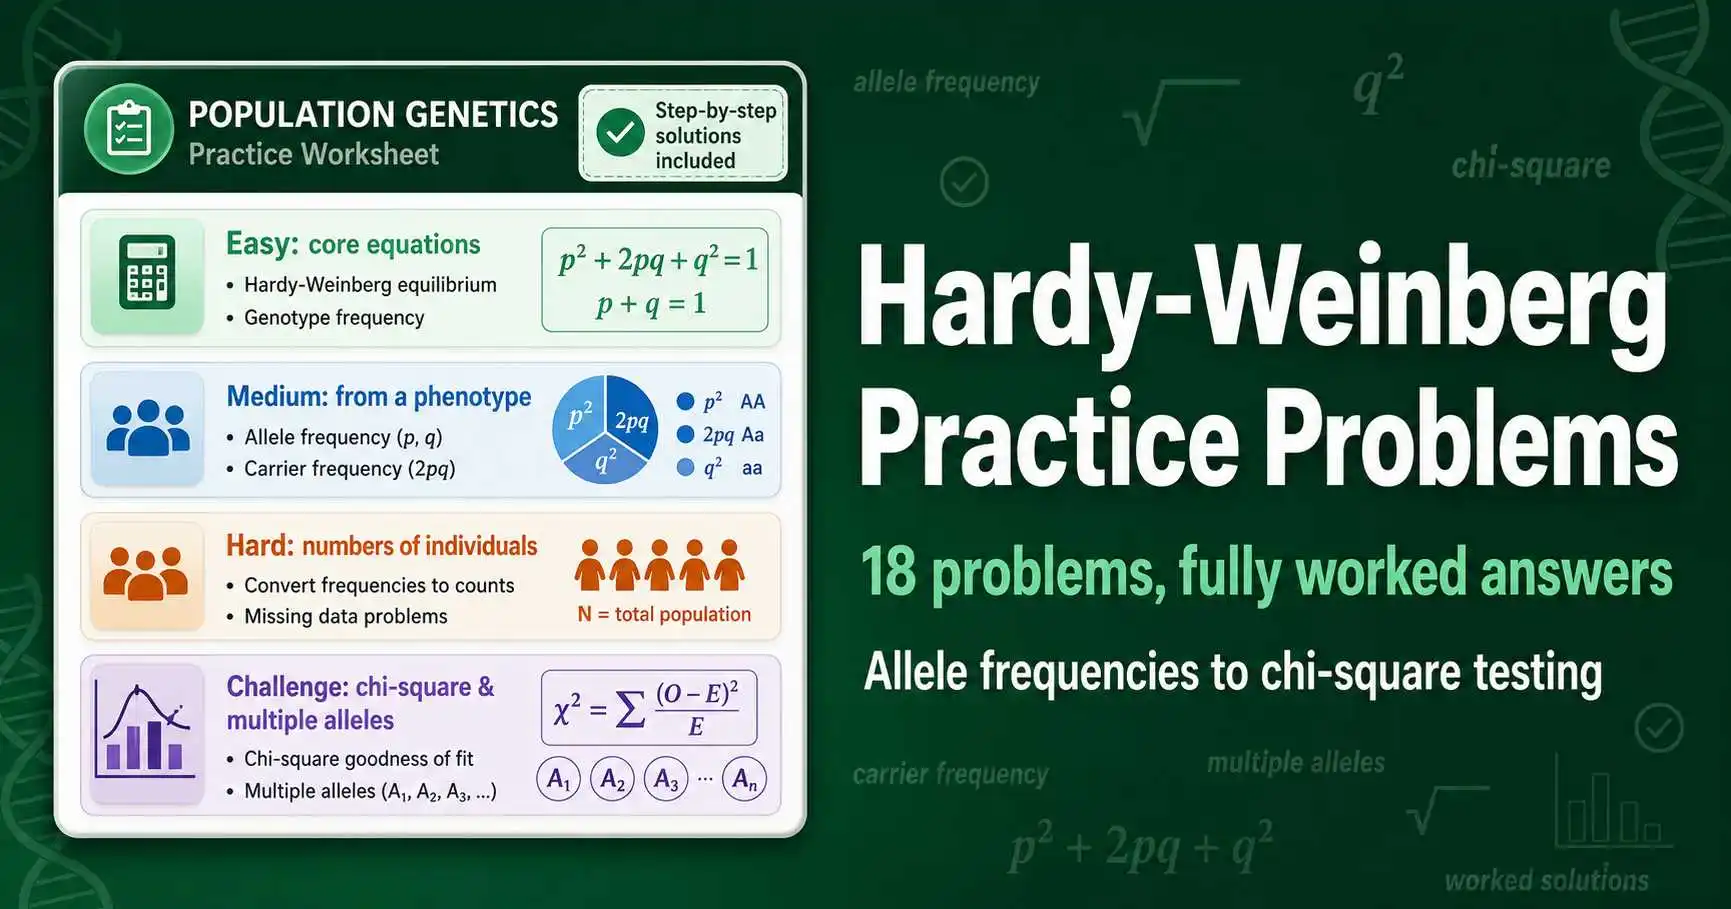
Graded Hardy-Weinberg practice problems with full worked answers, from allele frequencies and carrier calculations to the chi-square equilibrium test and multiple alleles.
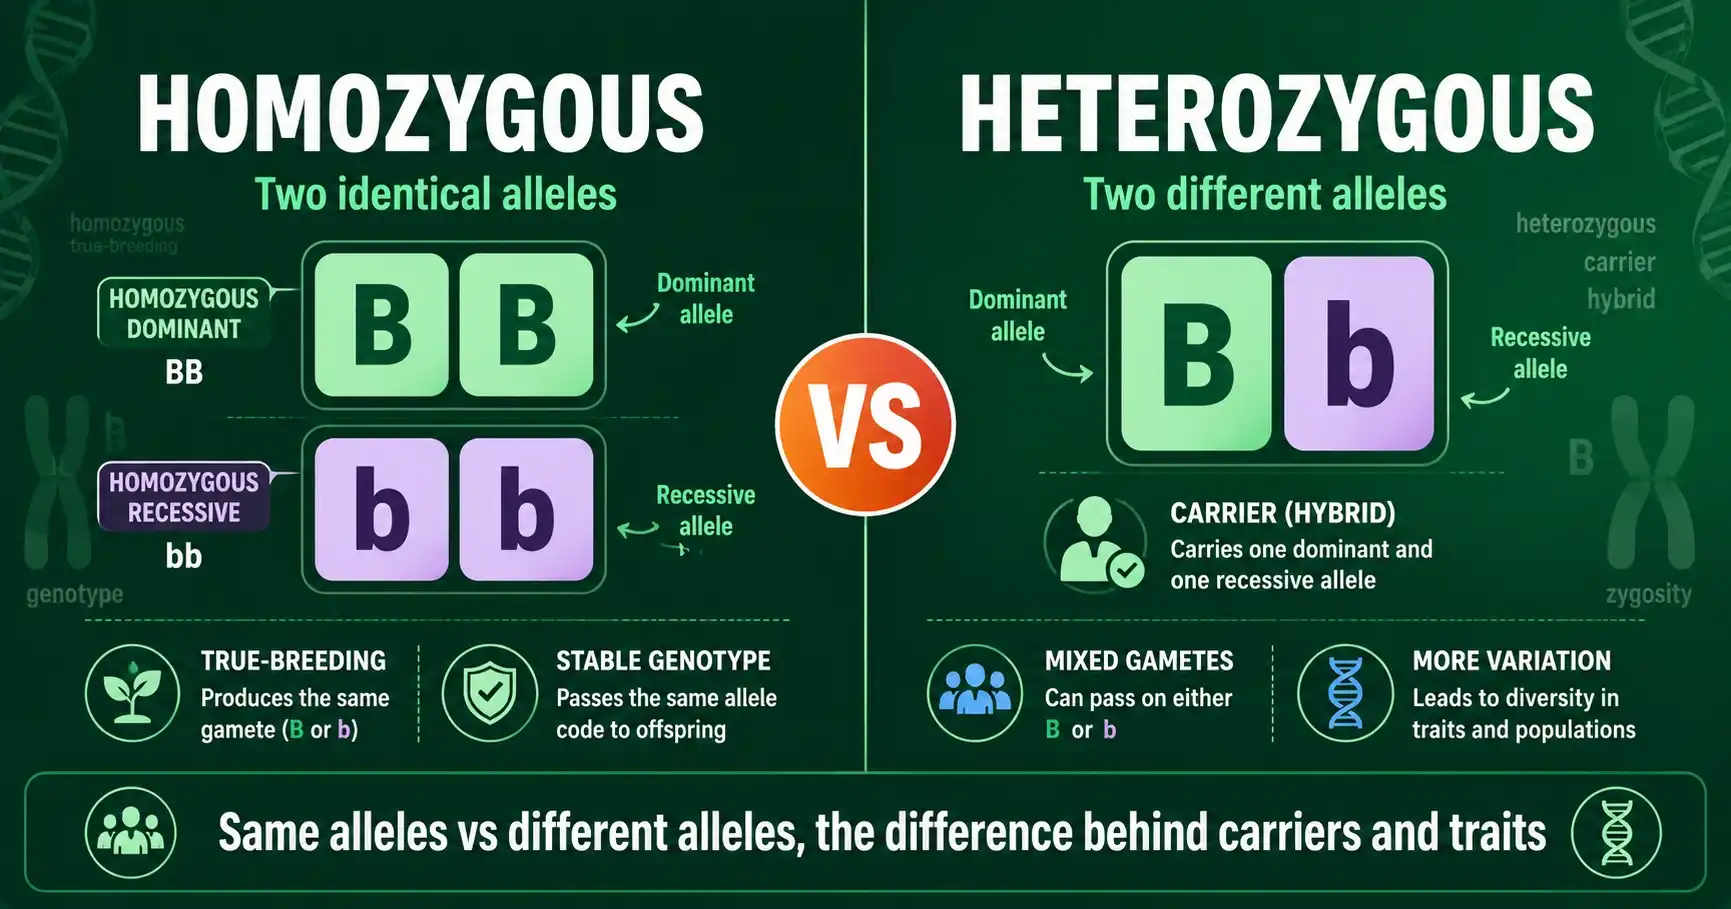
Homozygous means two identical alleles; heterozygous means two different alleles. Learn how to tell them apart, why looks can deceive, and what carriers are.
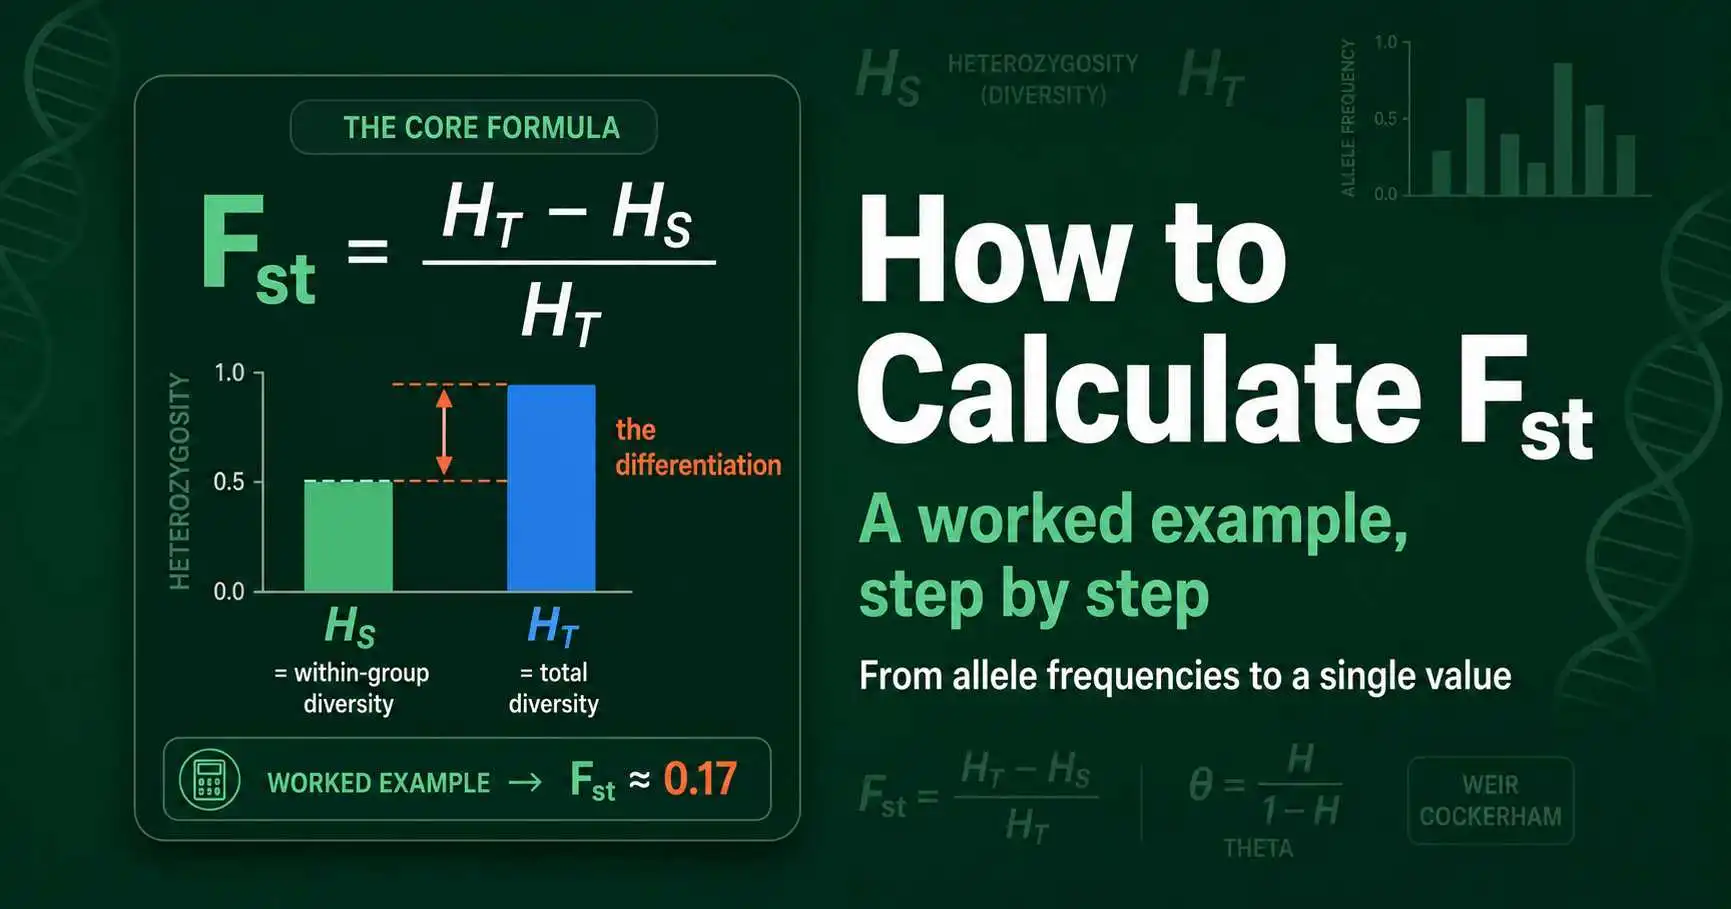
A step-by-step guide to calculating Fst, with a full worked example using Nei's heterozygosity method, plus how Wright's, Weir and Cockerham's, and Hudson's estimators differ.
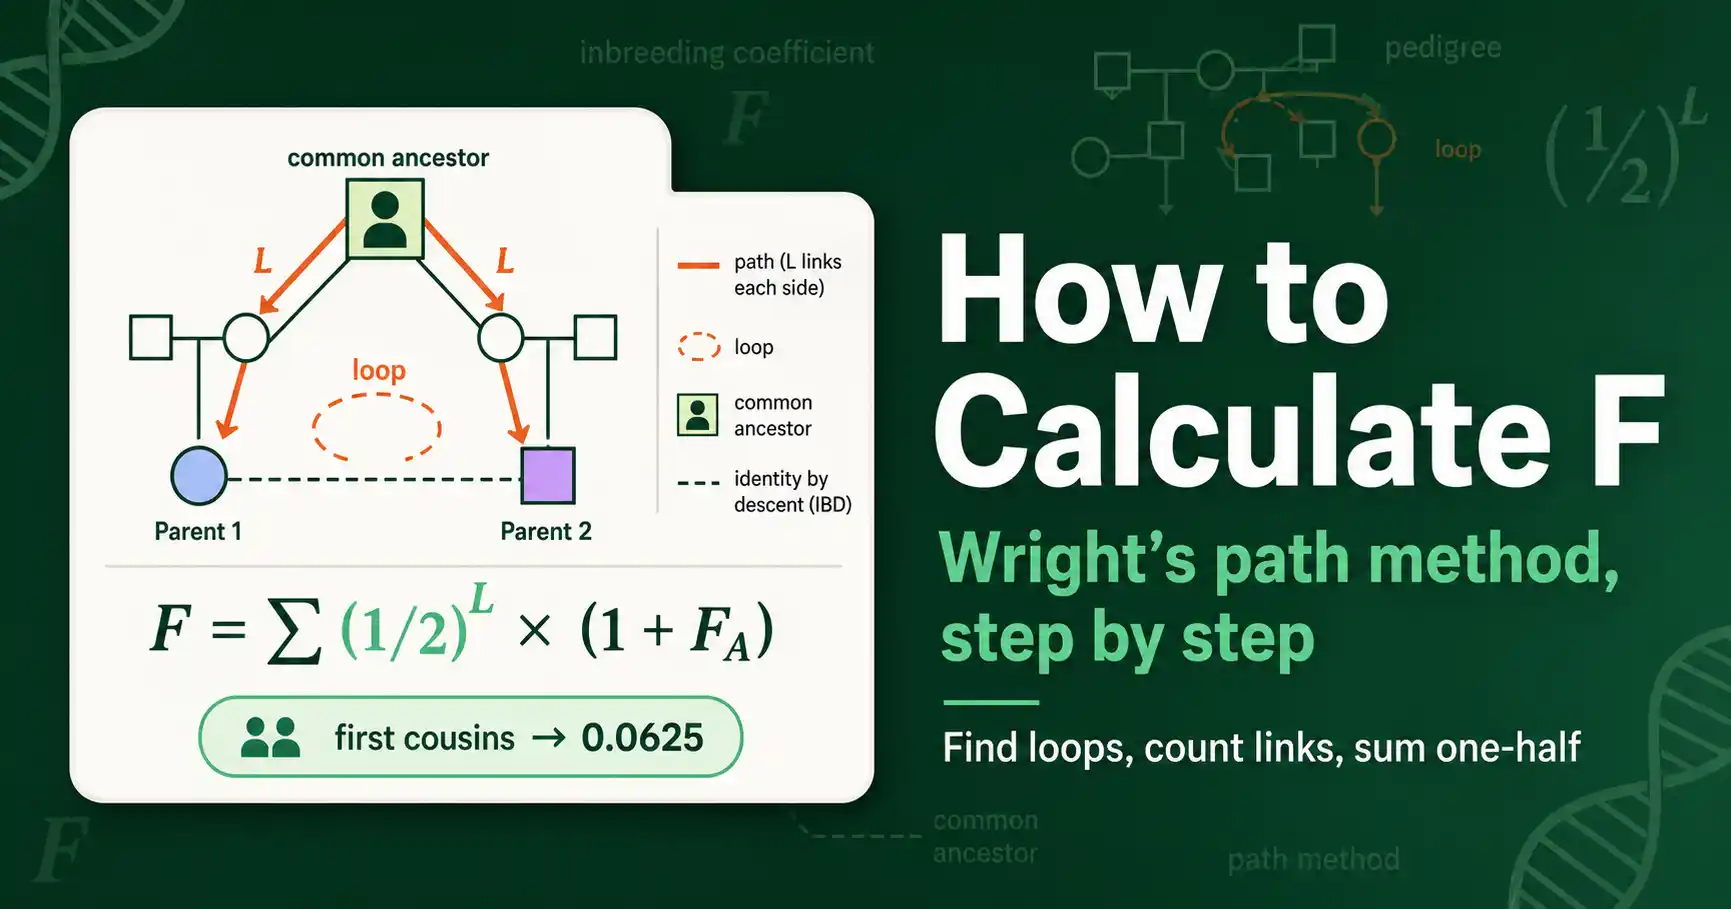
Calculate the inbreeding coefficient F with Wright's path method: find common ancestors, trace the loops, and sum (1/2) to the power of each loop's length. Worked examples included.
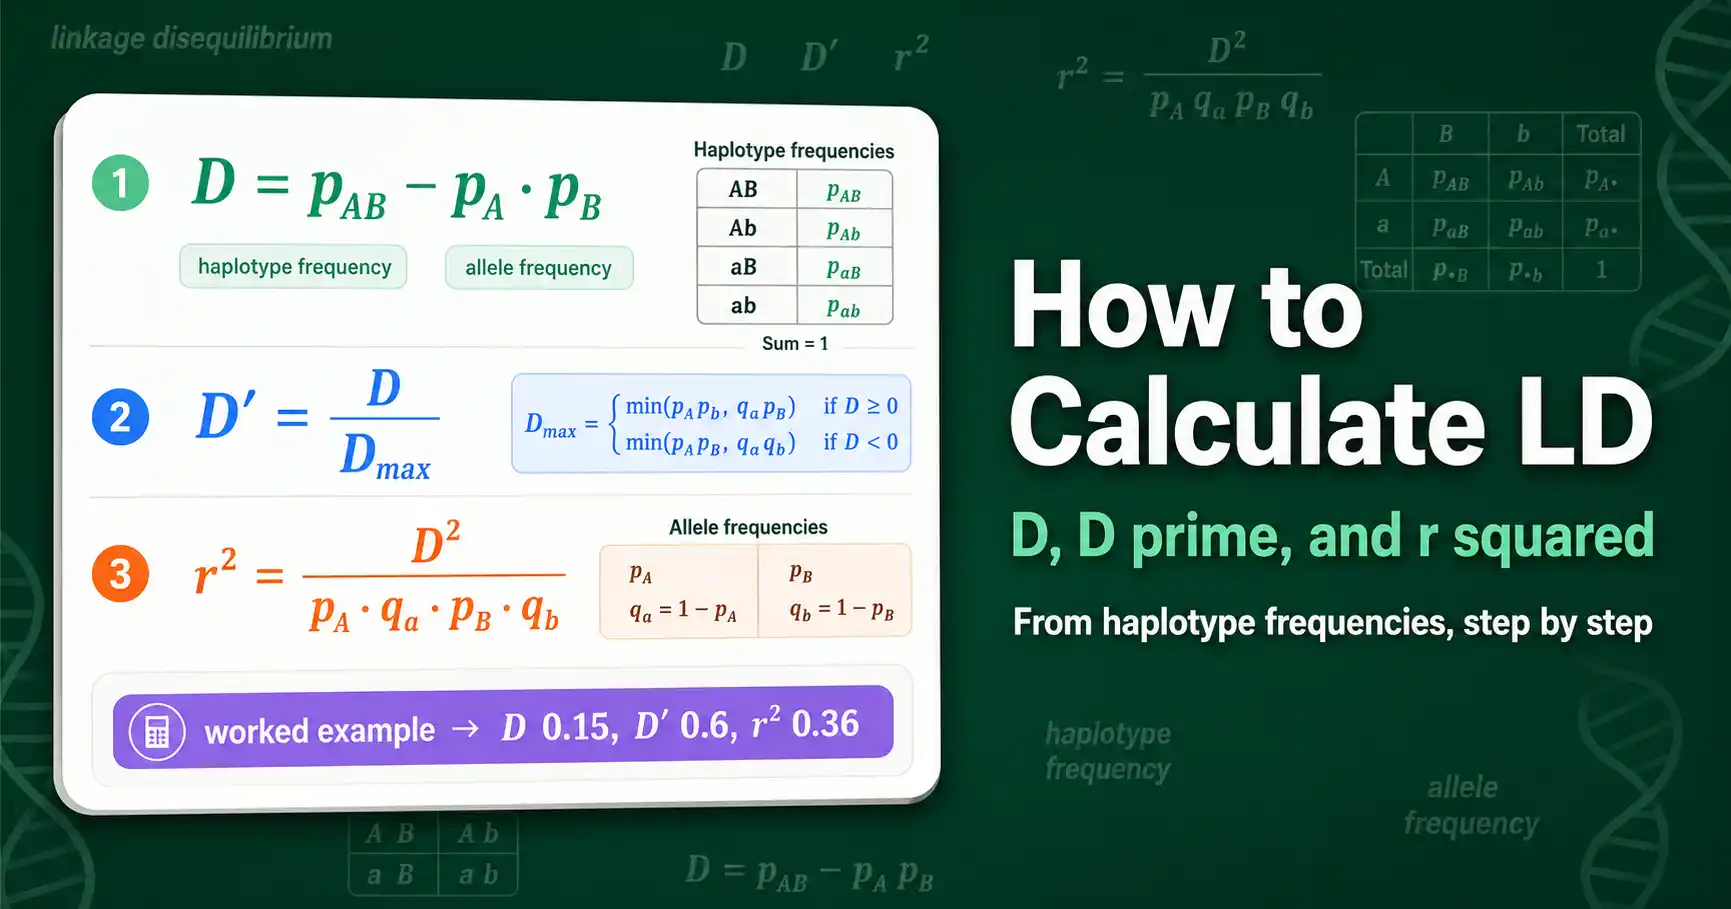
Calculate linkage disequilibrium step by step: the D coefficient, D' normalization, and r² from haplotype frequencies. Full worked example with the formulas explained.
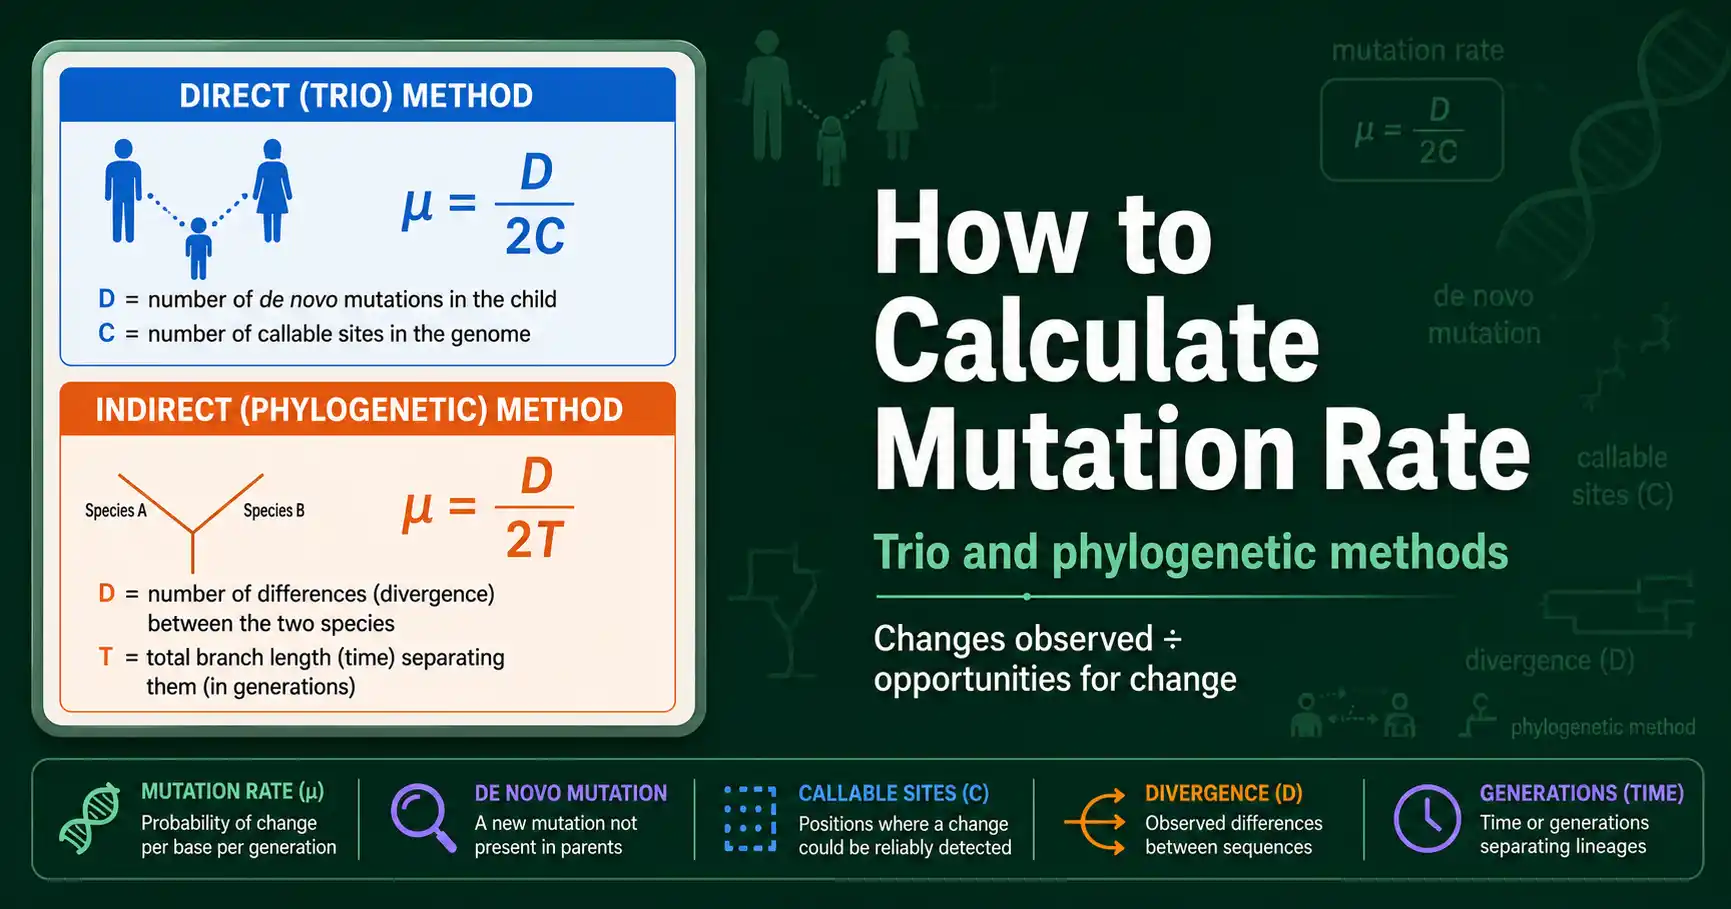
Calculate mutation rate two ways: the direct trio method (de novo mutations divided by callable sites) and the indirect phylogenetic method (divergence over time). Worked examples included.
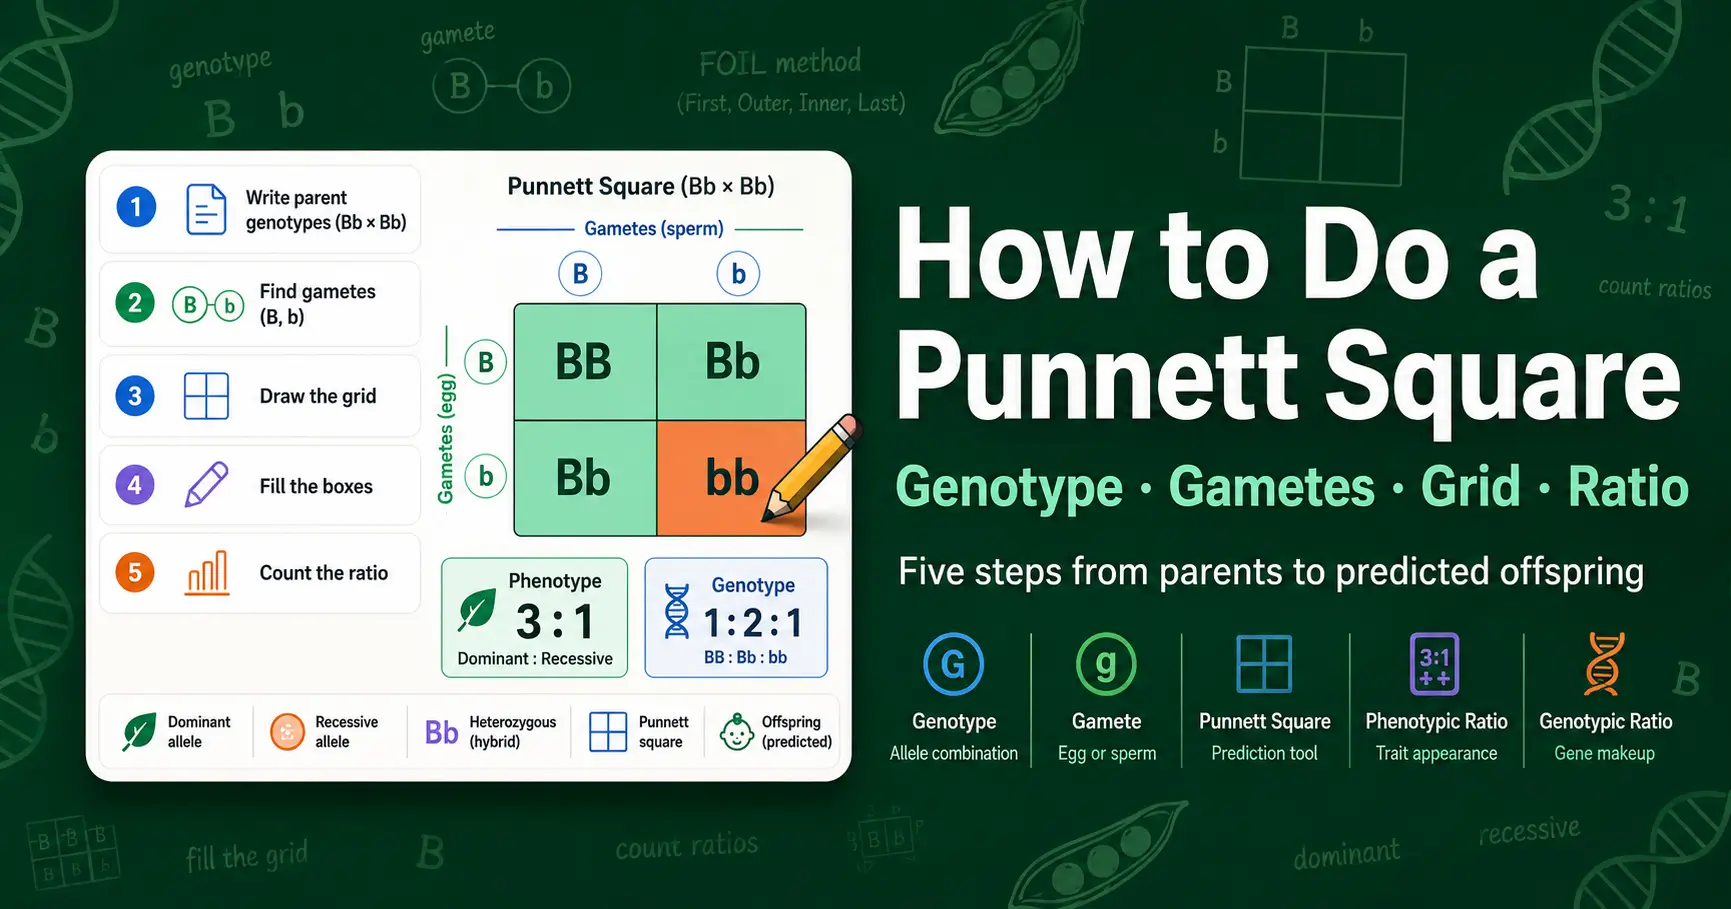
Learn how to do a Punnett square step by step. Find parent genotypes, work out gametes, fill the grid, and read the ratios, with clear worked examples.
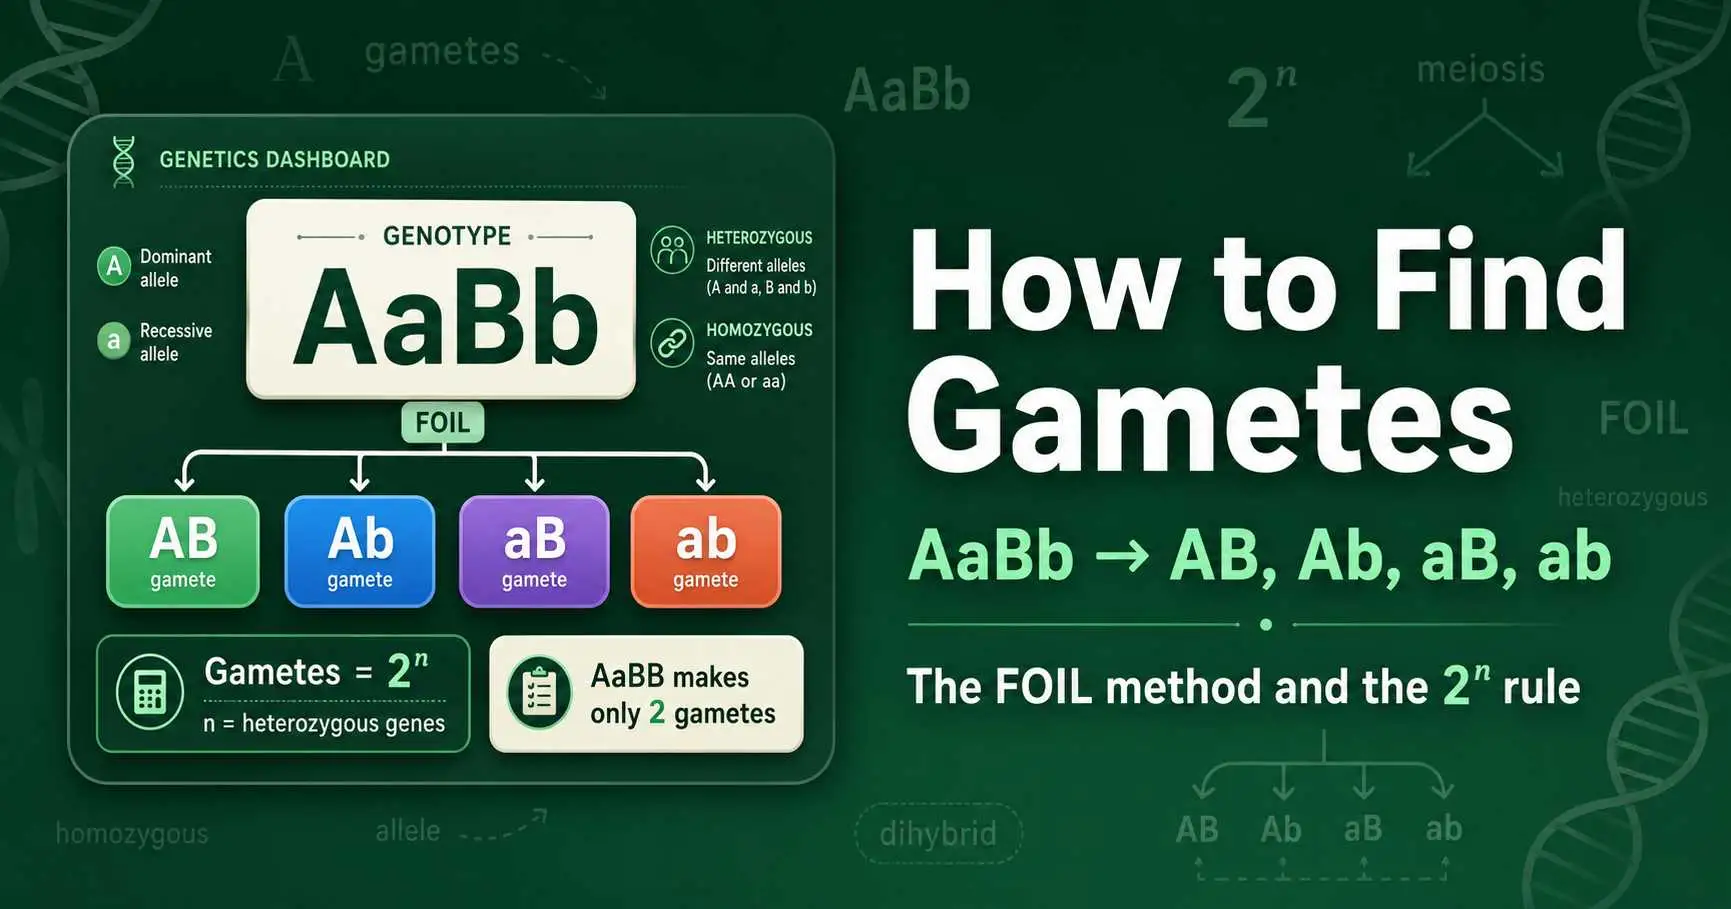
Learn how to find the gametes from any genotype. The FOIL method for AaBb, the 2^n rule for counting gametes, worked examples, and the mistakes to avoid.
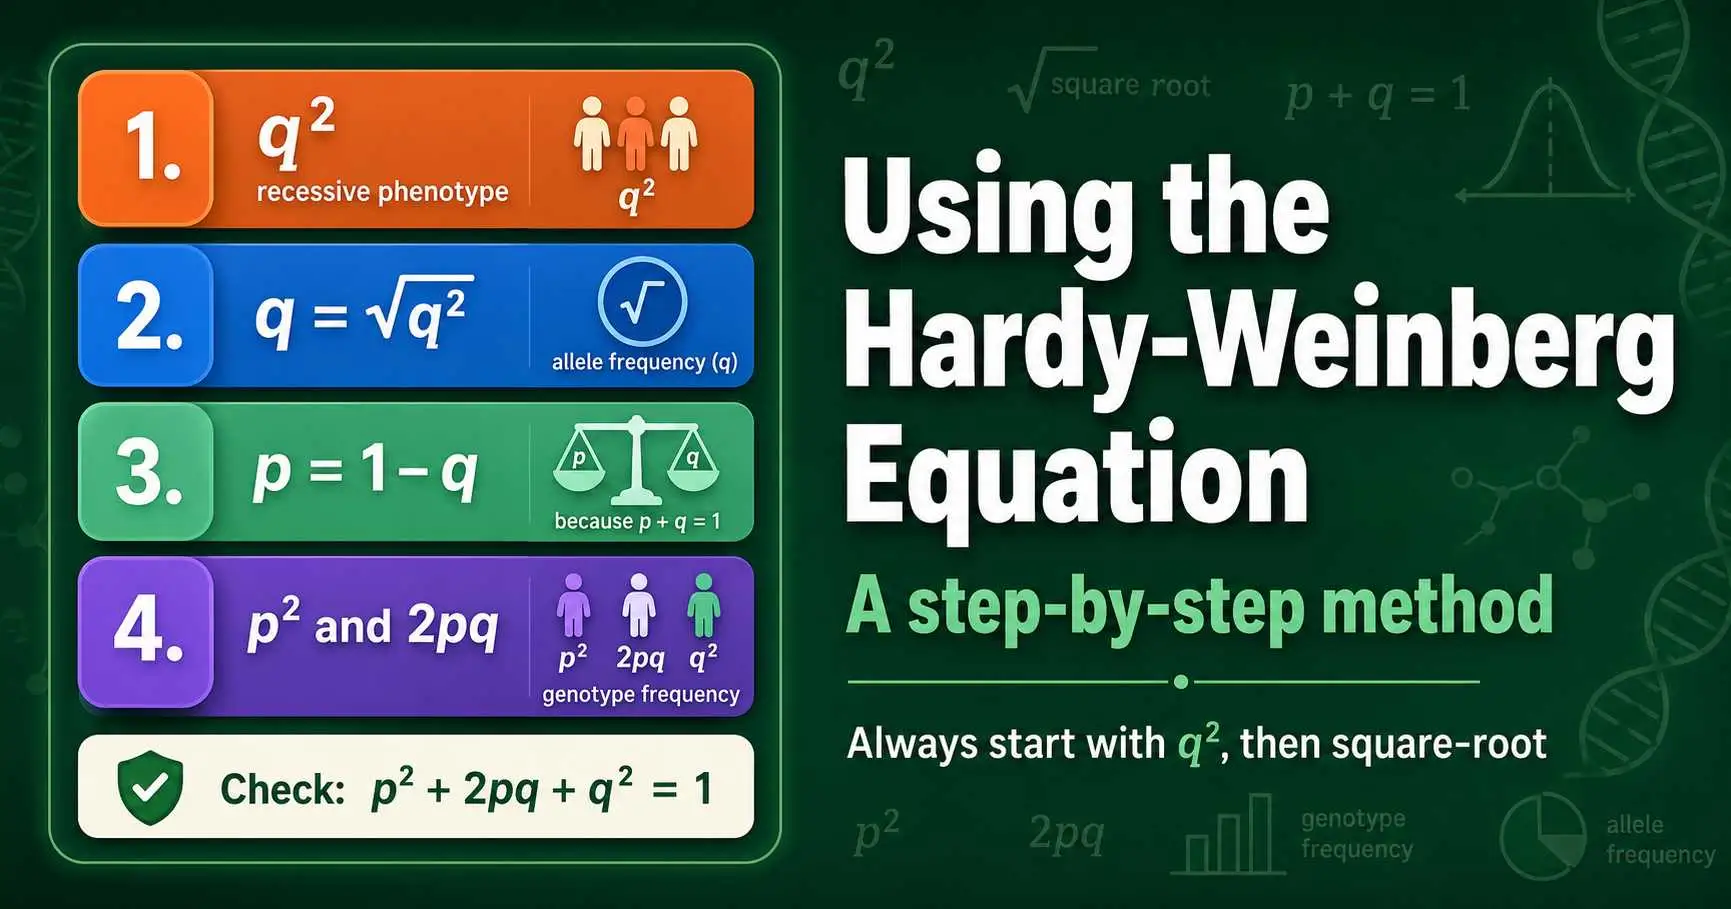
A step-by-step guide to using the Hardy-Weinberg equation. Start with q2, find q, then p, then p2 and 2pq, with worked examples and the always-start-with-q2 rule.
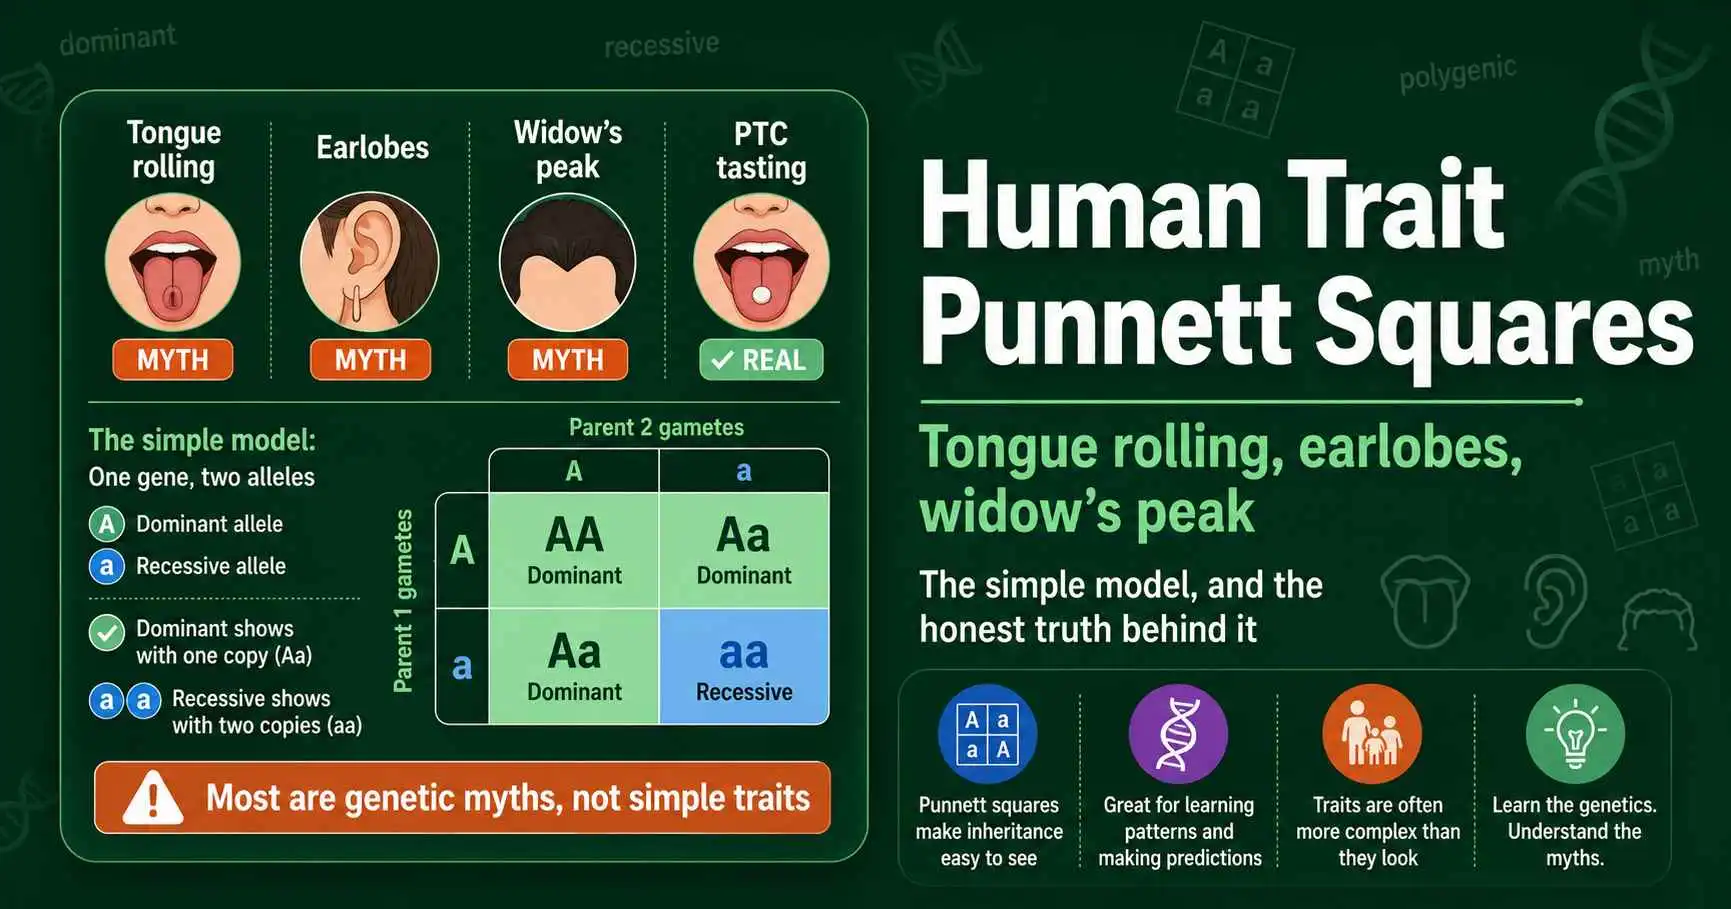
Punnett squares for classic human traits like tongue rolling, earlobes, and widow's peak, plus the honest truth: most are genetic myths, not simple Mendelian traits.
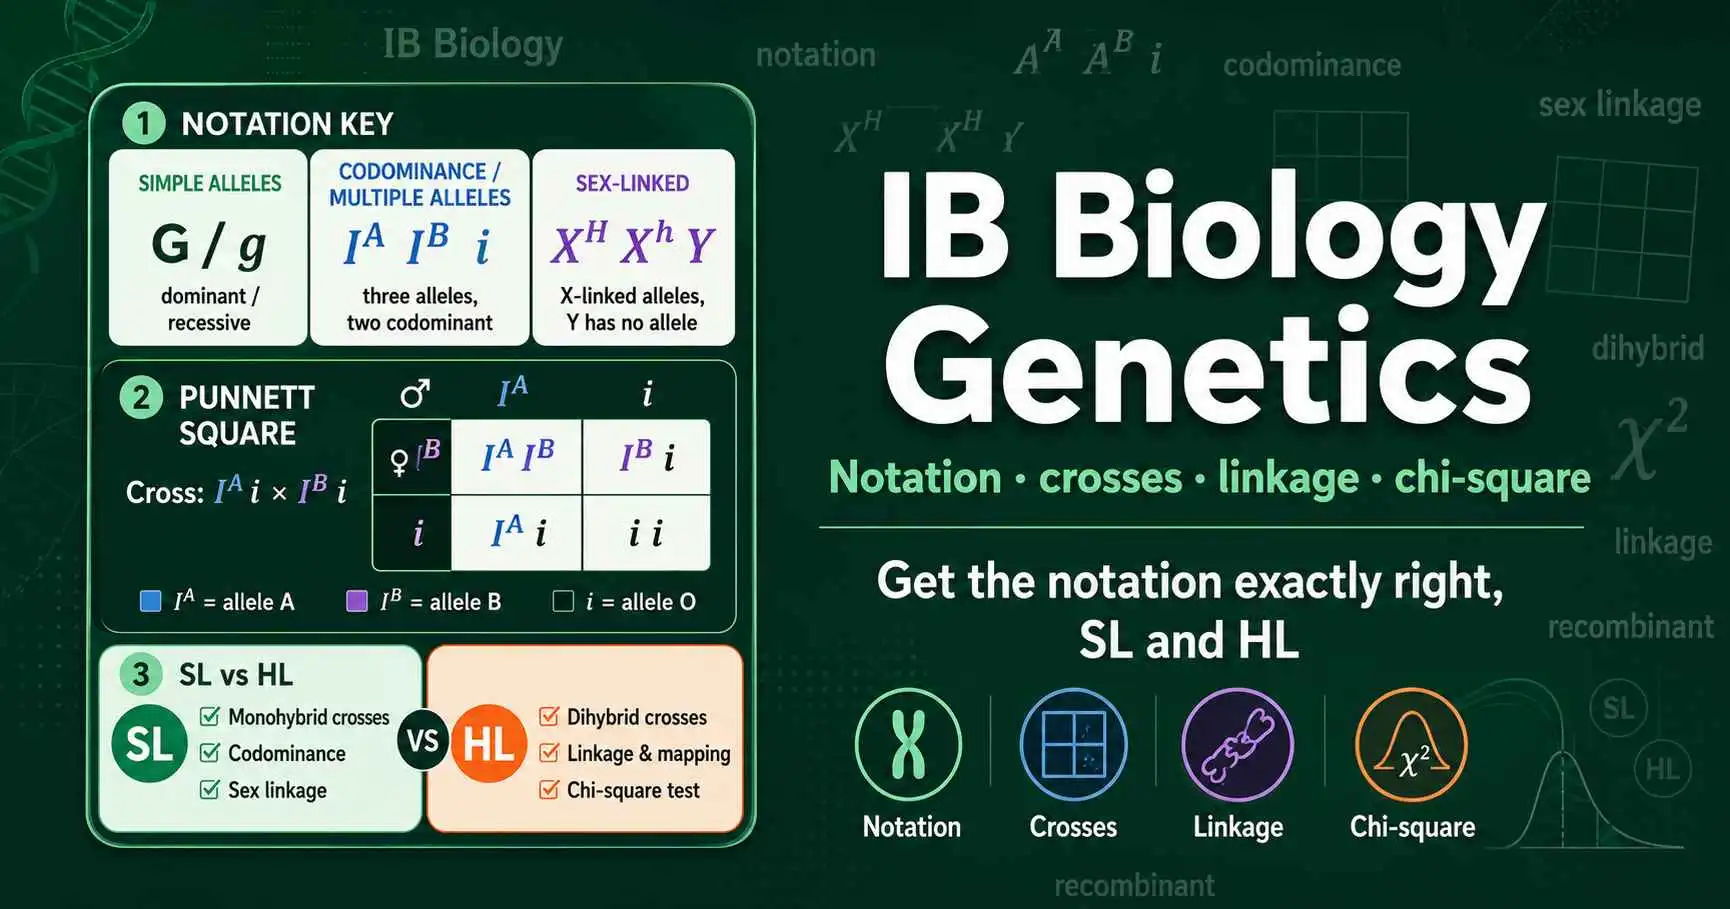
IB Biology genetics made clear: correct allele notation, monohybrid and dihybrid crosses, codominance, sex linkage, and the chi-square test for linked genes.
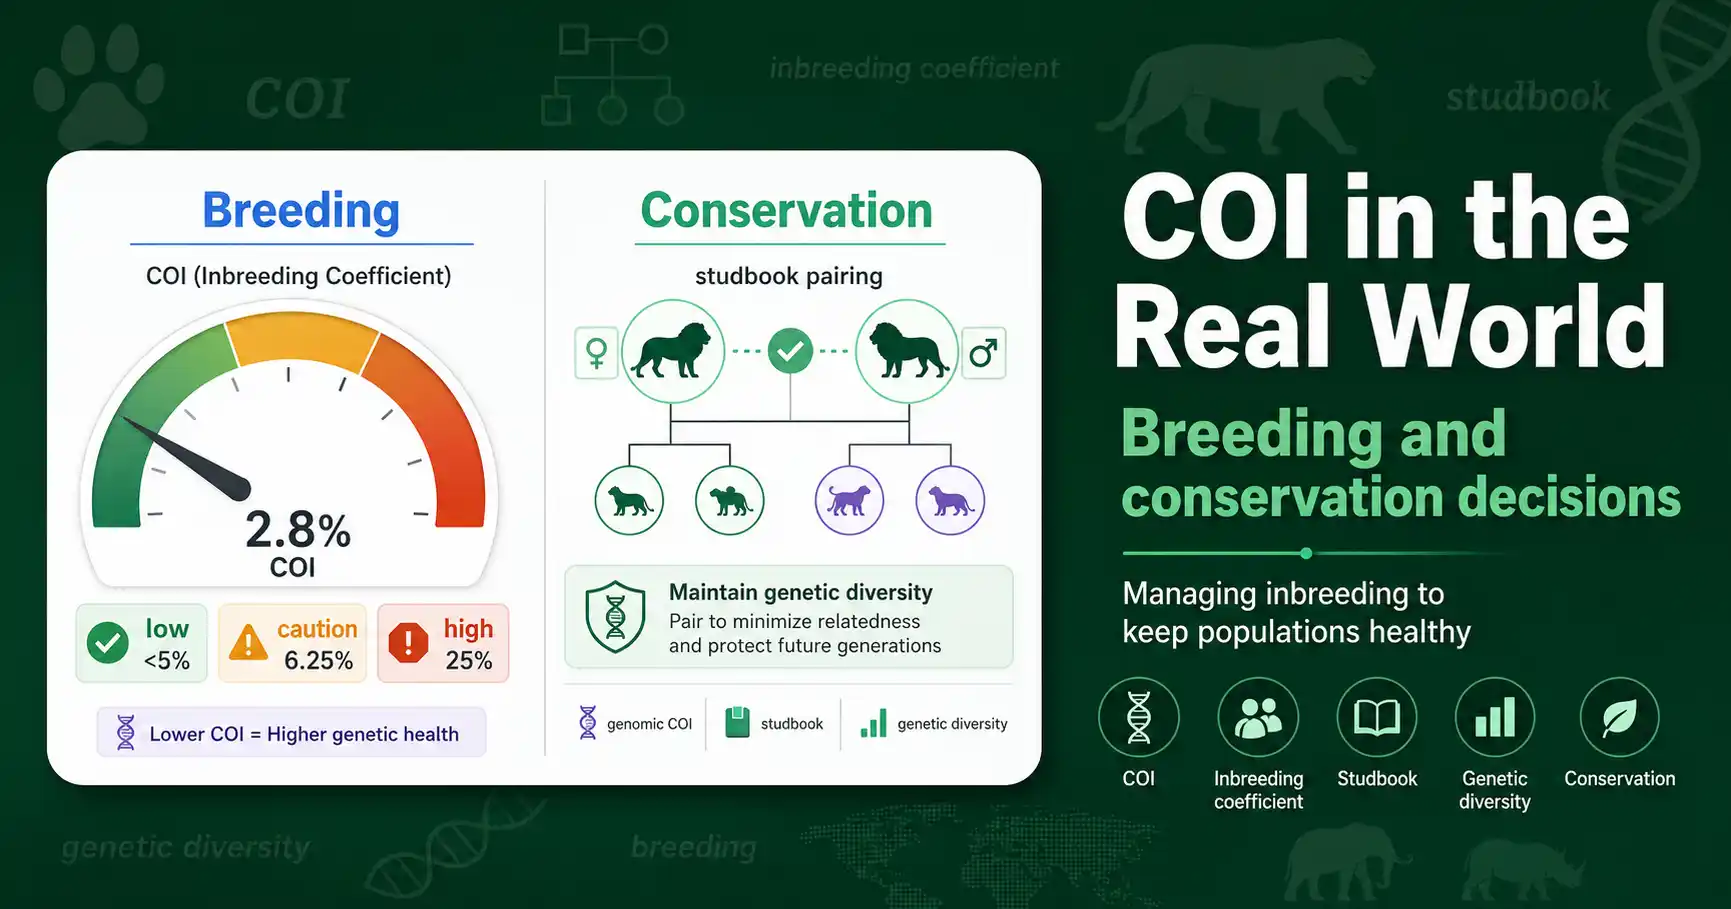
How the inbreeding coefficient (COI) guides real decisions: dog and livestock breeding thresholds, endangered-species studbooks, and managing genetic diversity in small populations.
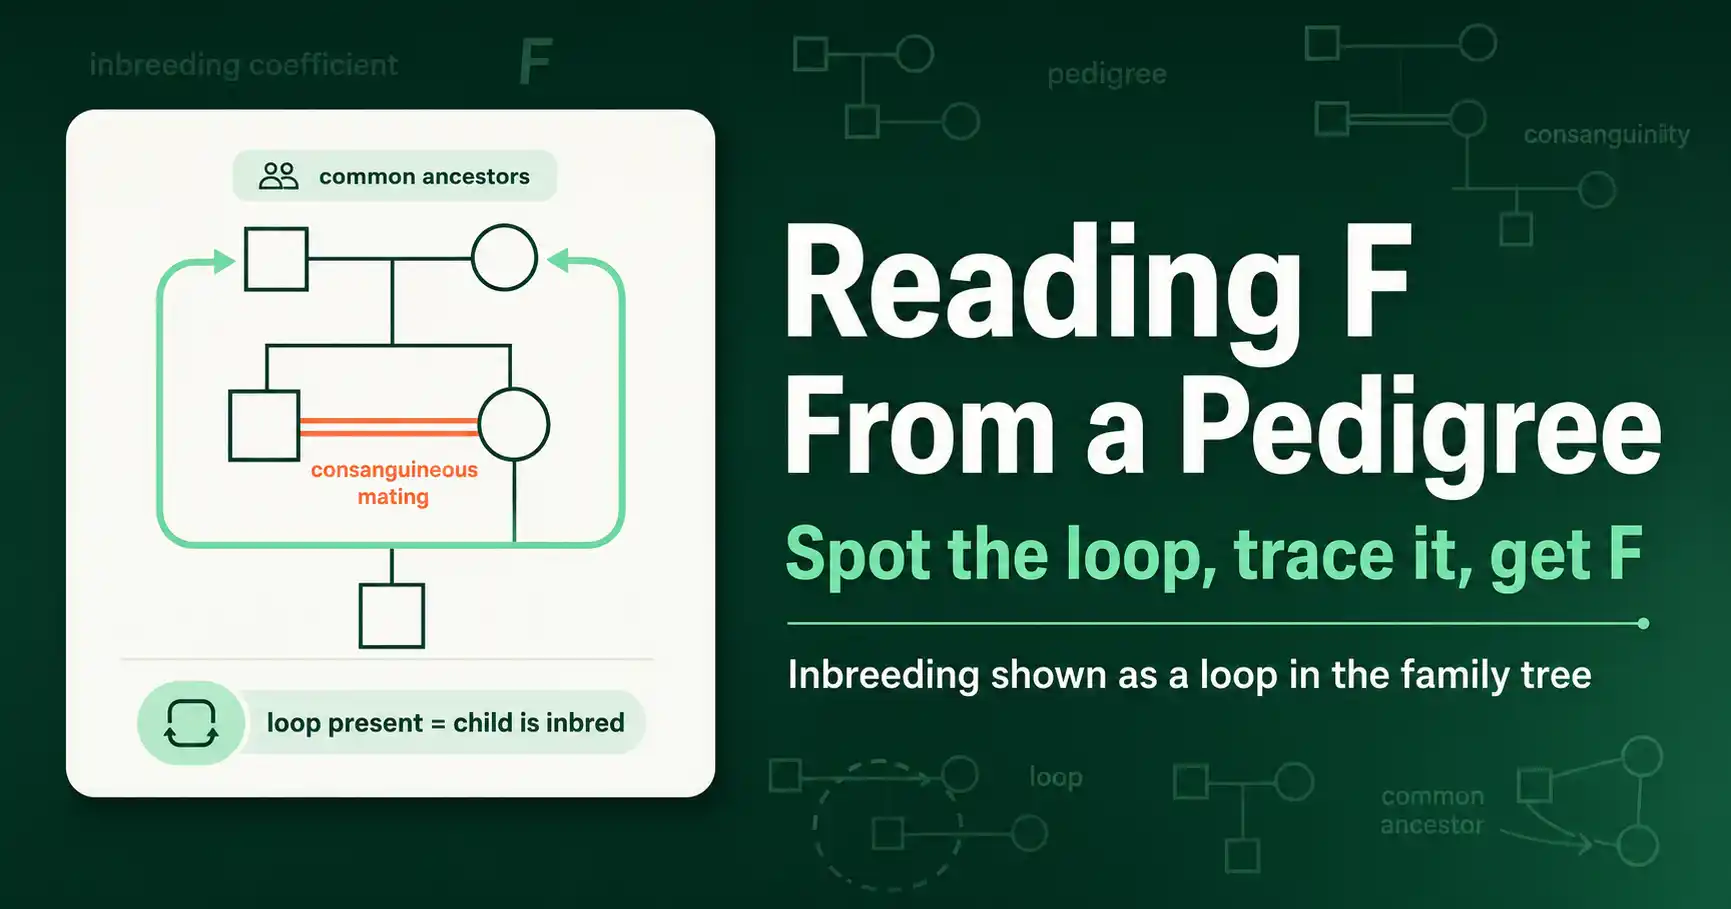
How to read the inbreeding coefficient off a family tree: spot the consanguinity loop, identify common ancestors, and calculate F directly from pedigree symbols.
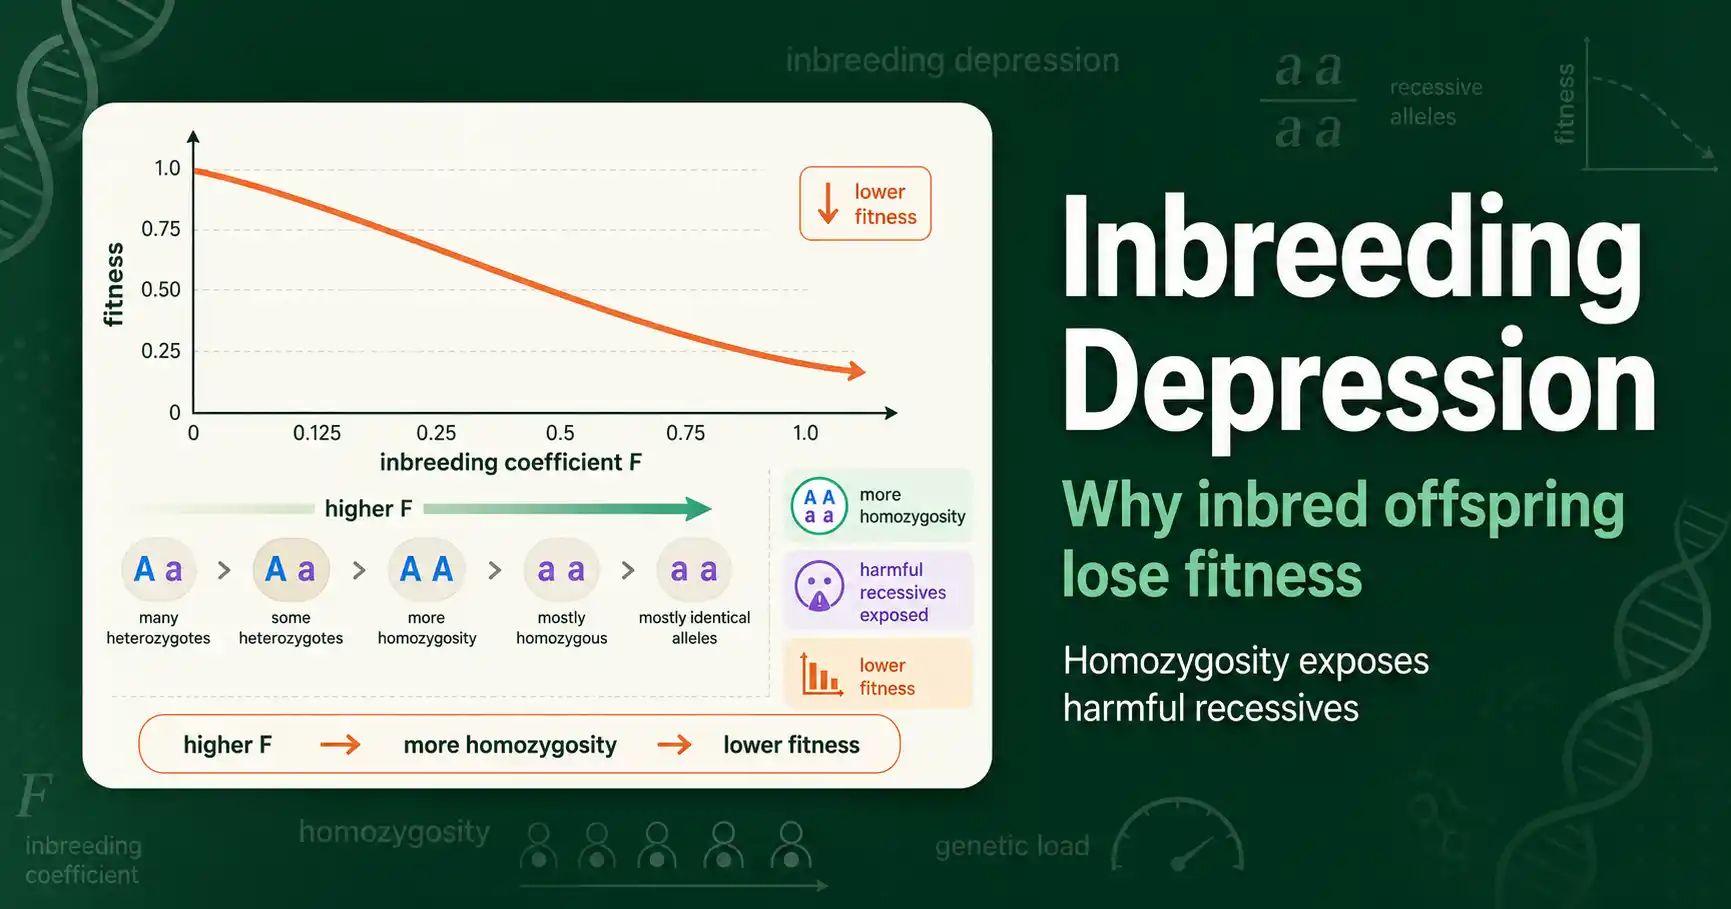
Inbreeding depression is the drop in fitness, survival, and fertility in inbred individuals. Learn why it happens, the genetics behind it, and how it shapes breeding and conservation.
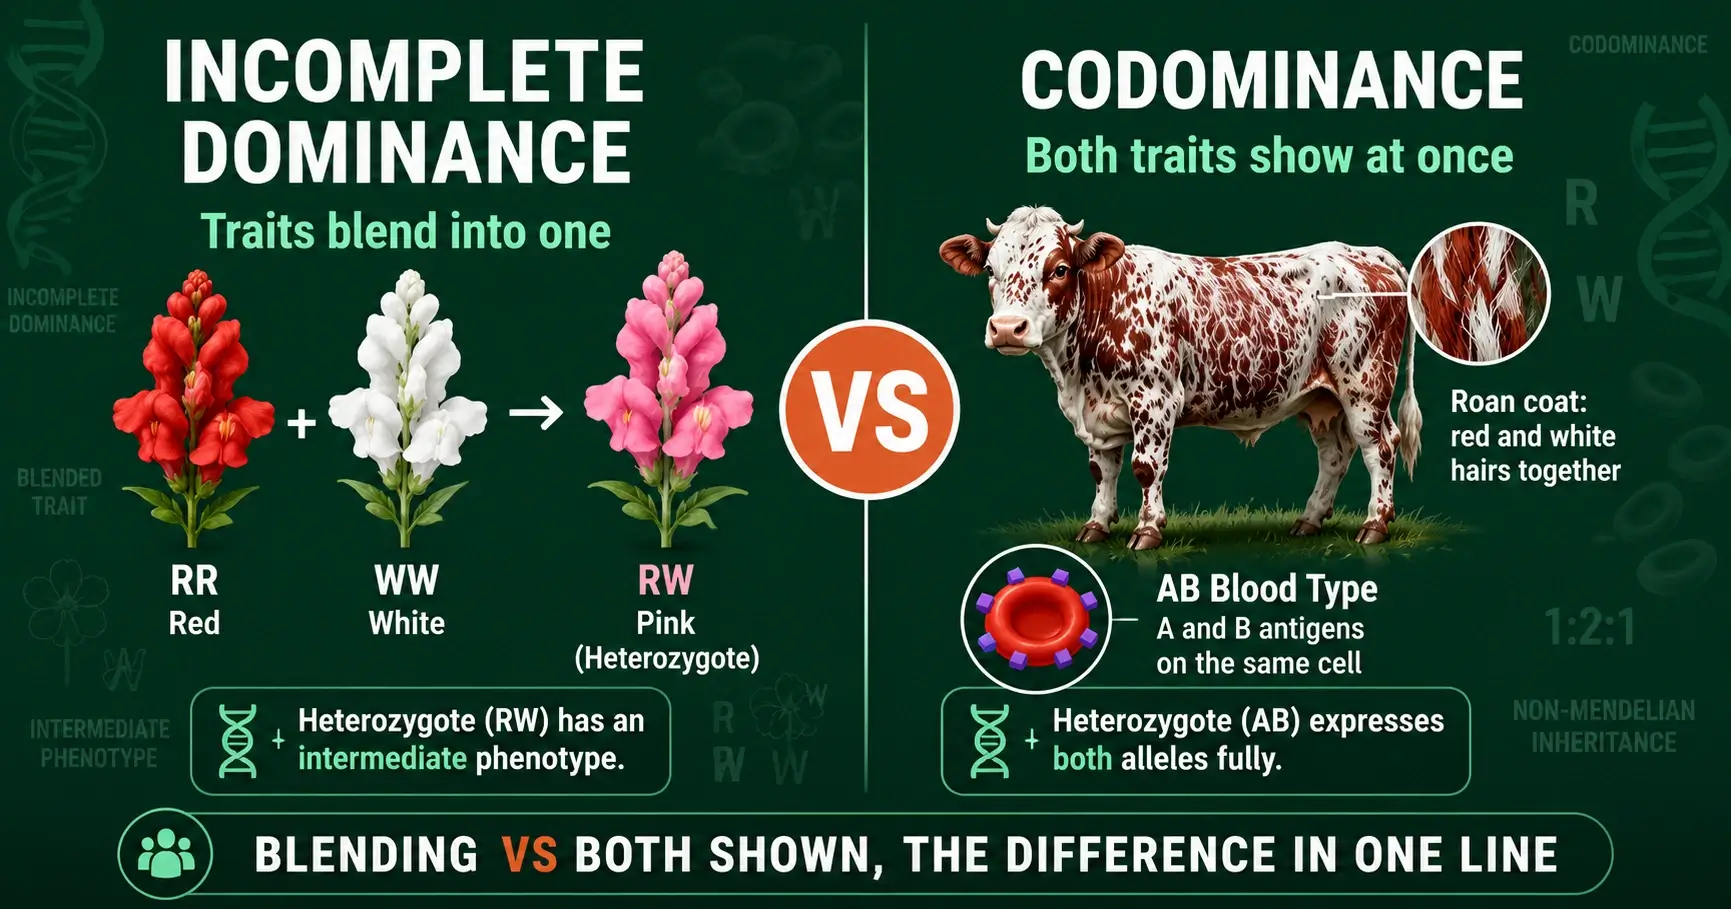
Incomplete dominance blends two alleles into one trait; codominance shows both at once. Learn the difference, with snapdragon, blood type, and roan examples.
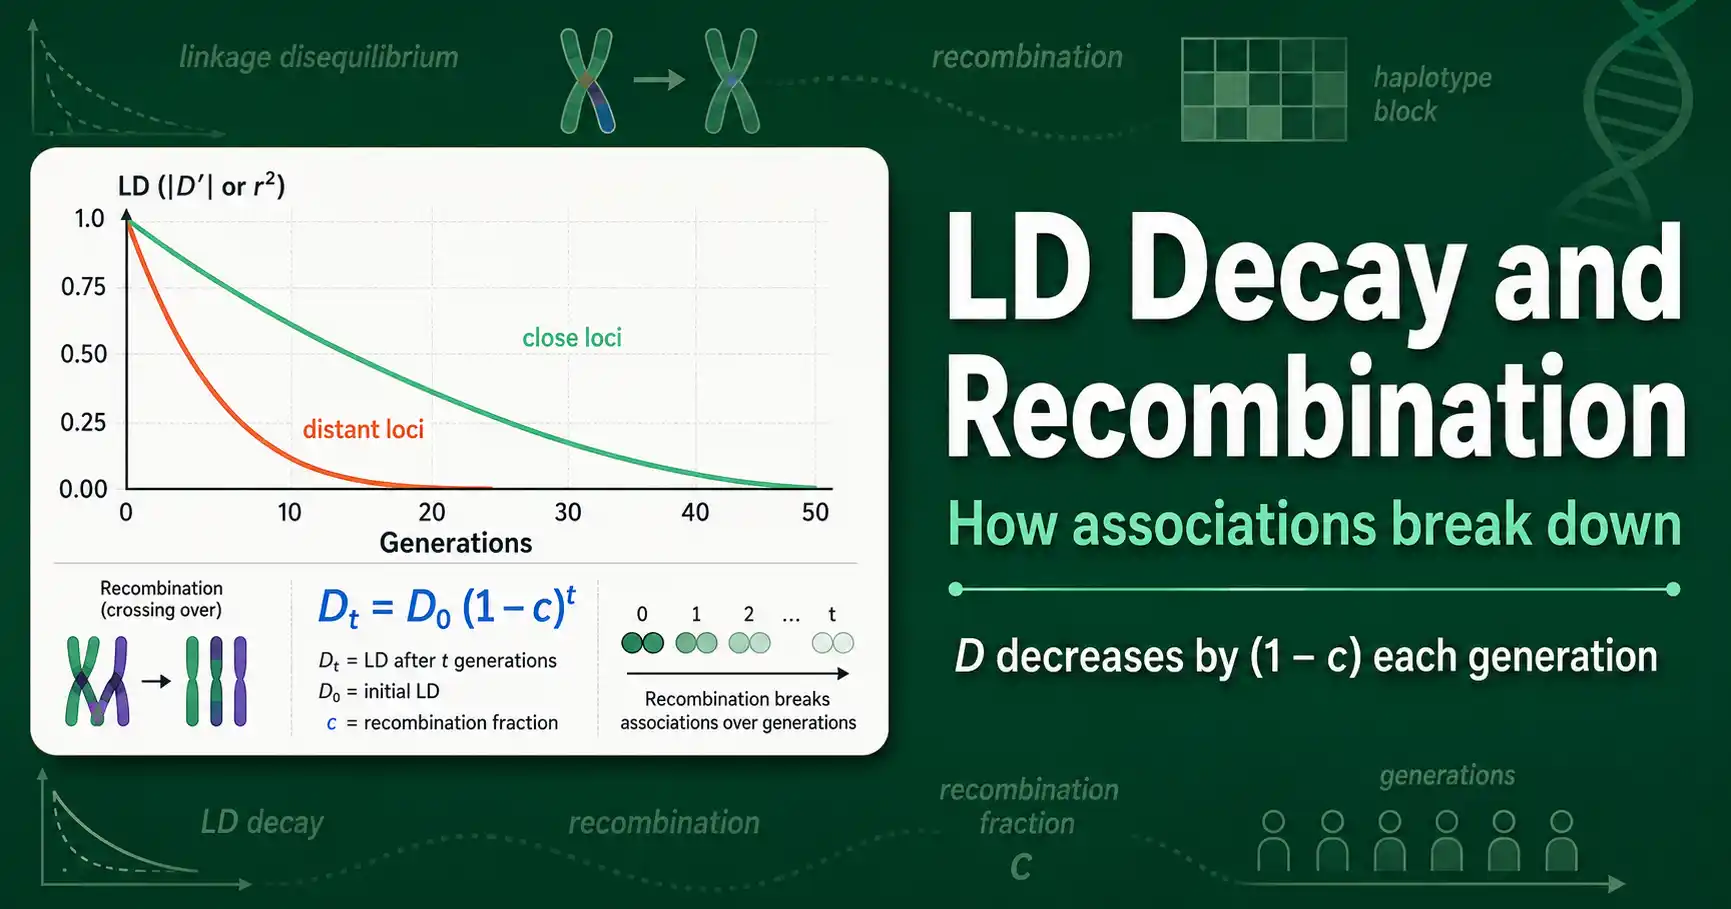
Linkage disequilibrium decays over generations as recombination breaks up allele associations. Learn the decay formula, why distance matters, and how haplotype blocks form.
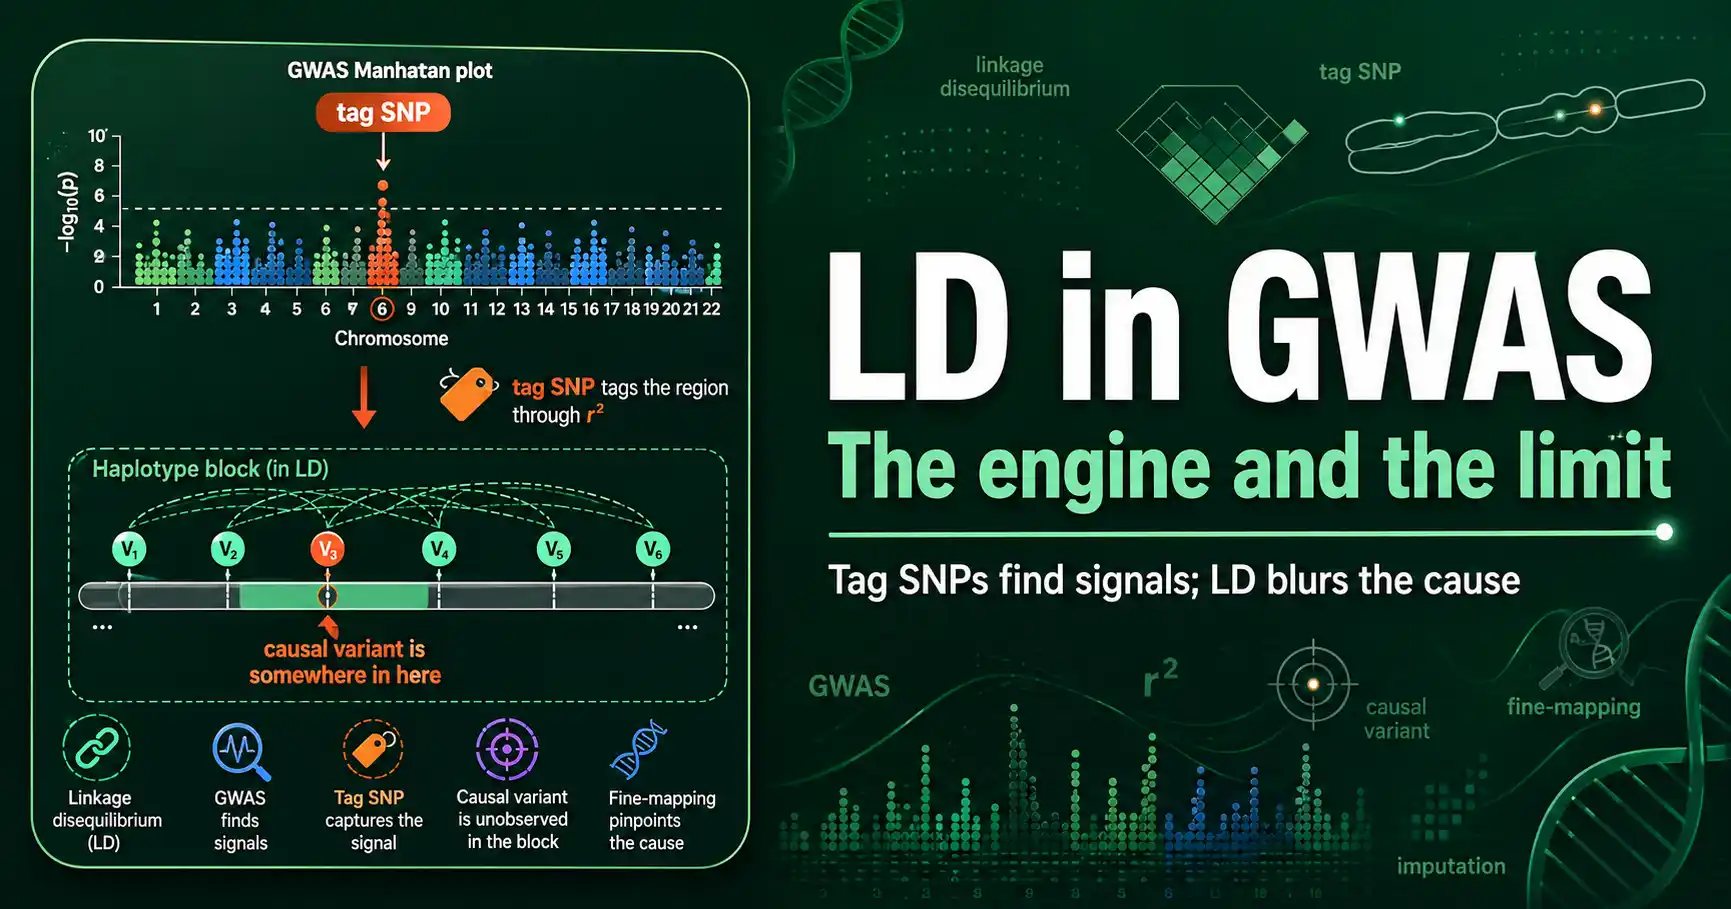
Linkage disequilibrium makes genome-wide association studies possible through tag SNPs, but it also means hits aren't always causal. Here is how LD drives GWAS, fine-mapping, and imputation.
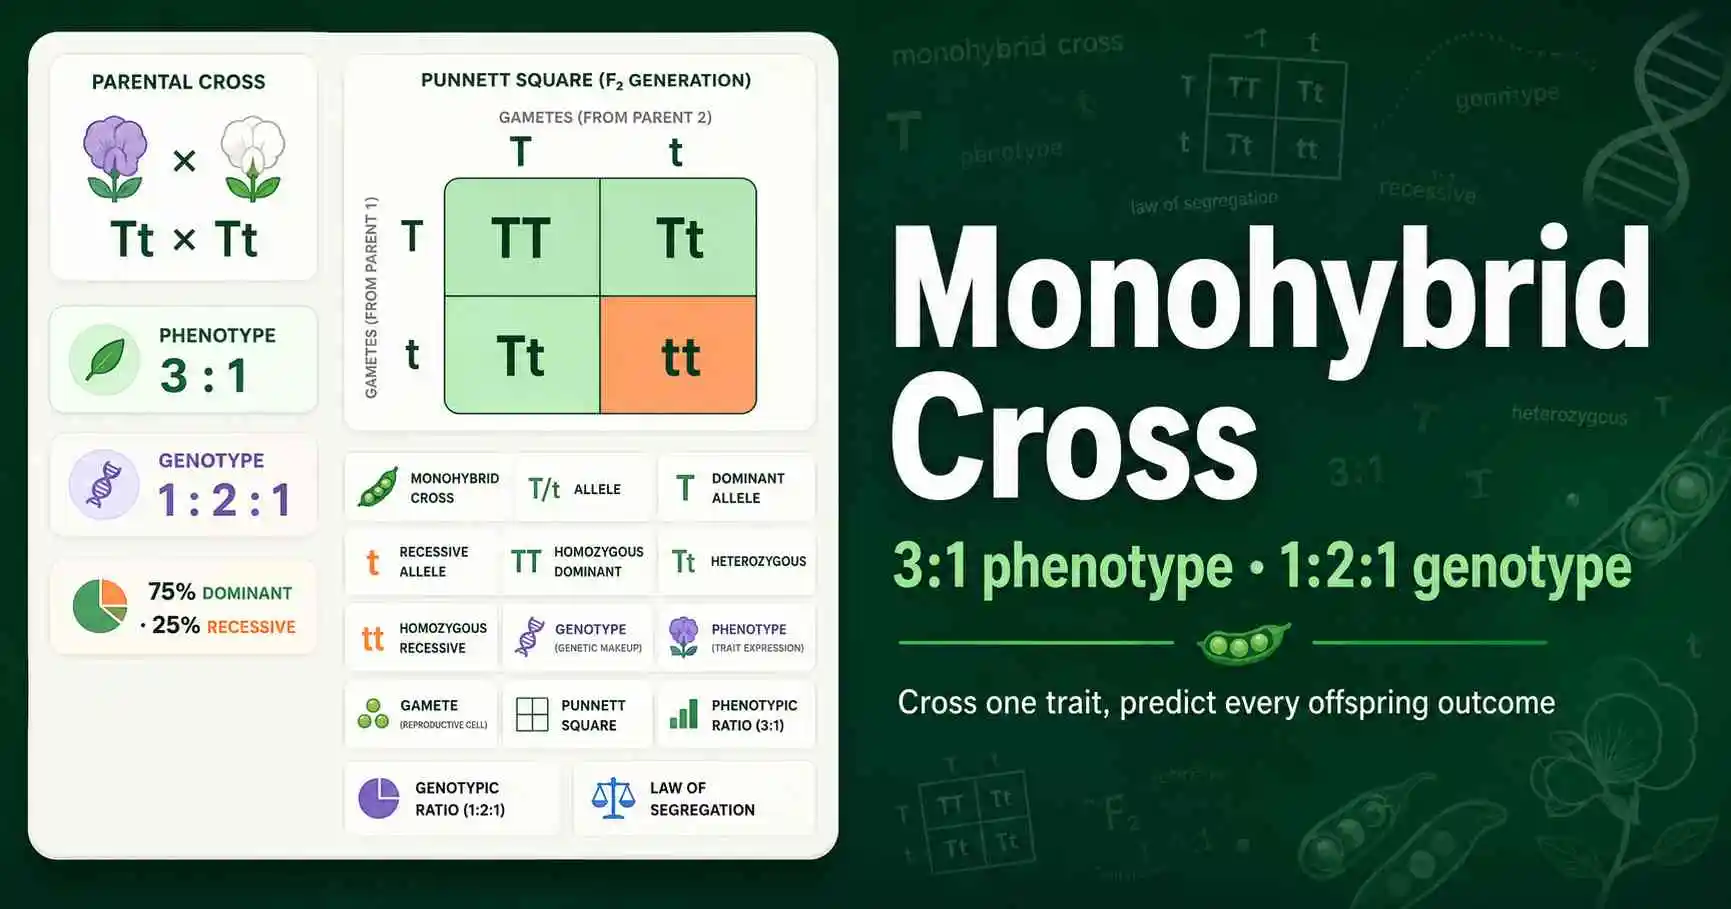
A monohybrid cross gives a 3:1 phenotype and 1:2:1 genotype ratio. Learn where these ratios come from and how to work them out, with Mendel's pea examples.
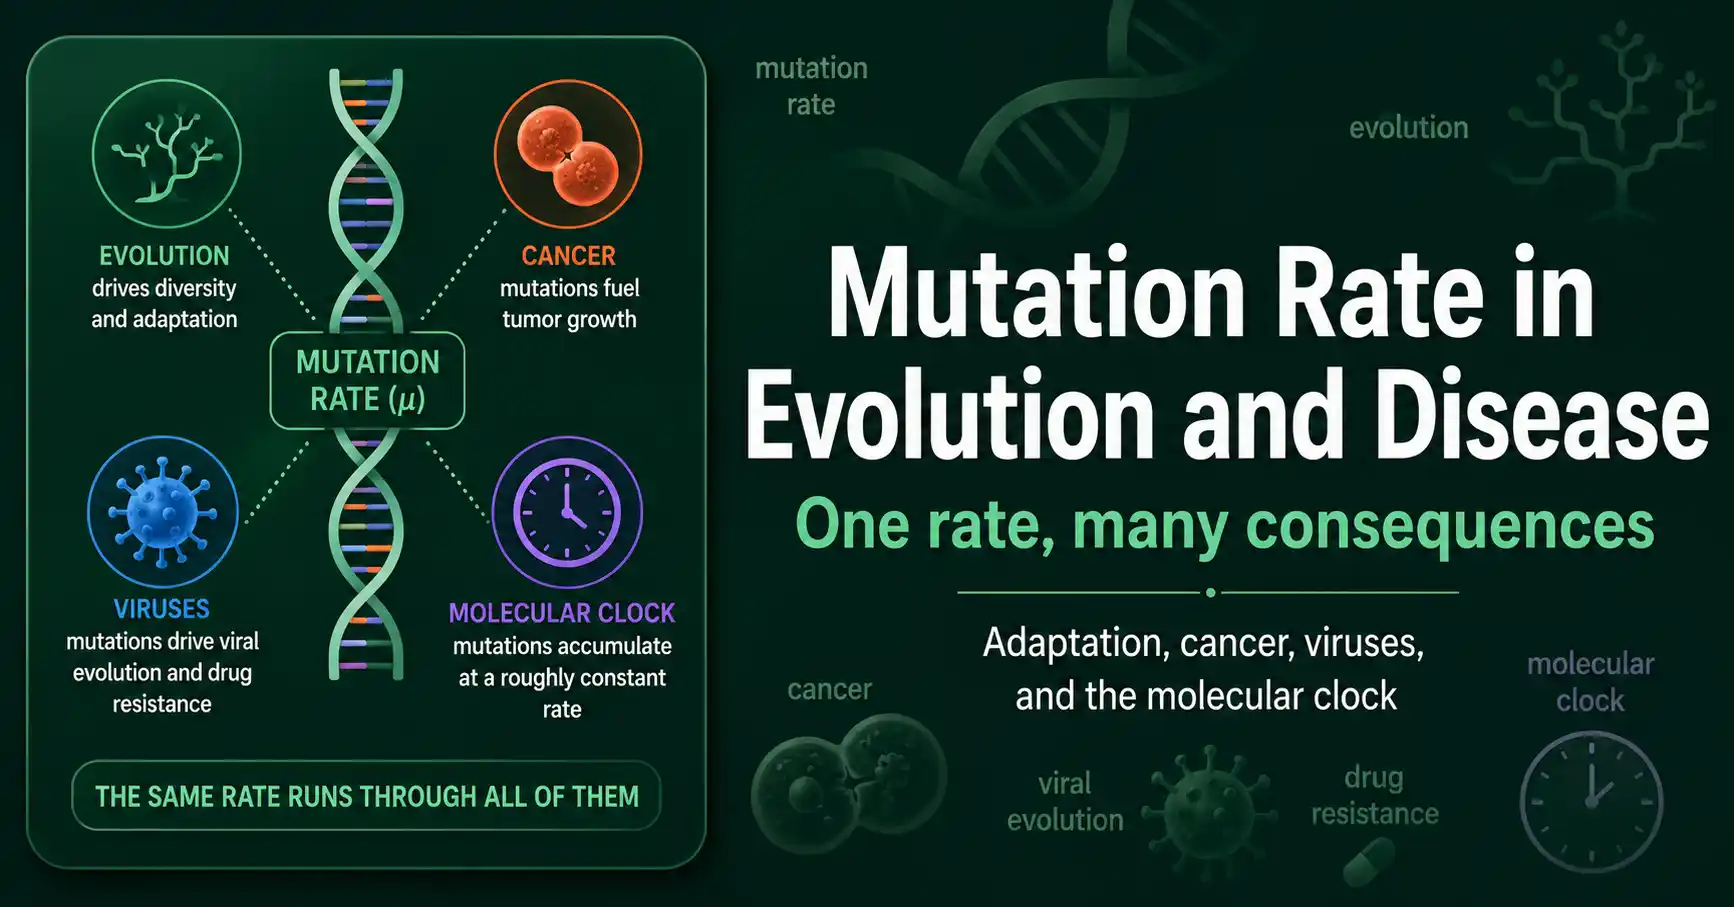
Mutation rate shapes evolution, cancer, viral drug resistance, and the molecular clock. Here is how the rate of new mutations drives both adaptation and disease across biology.
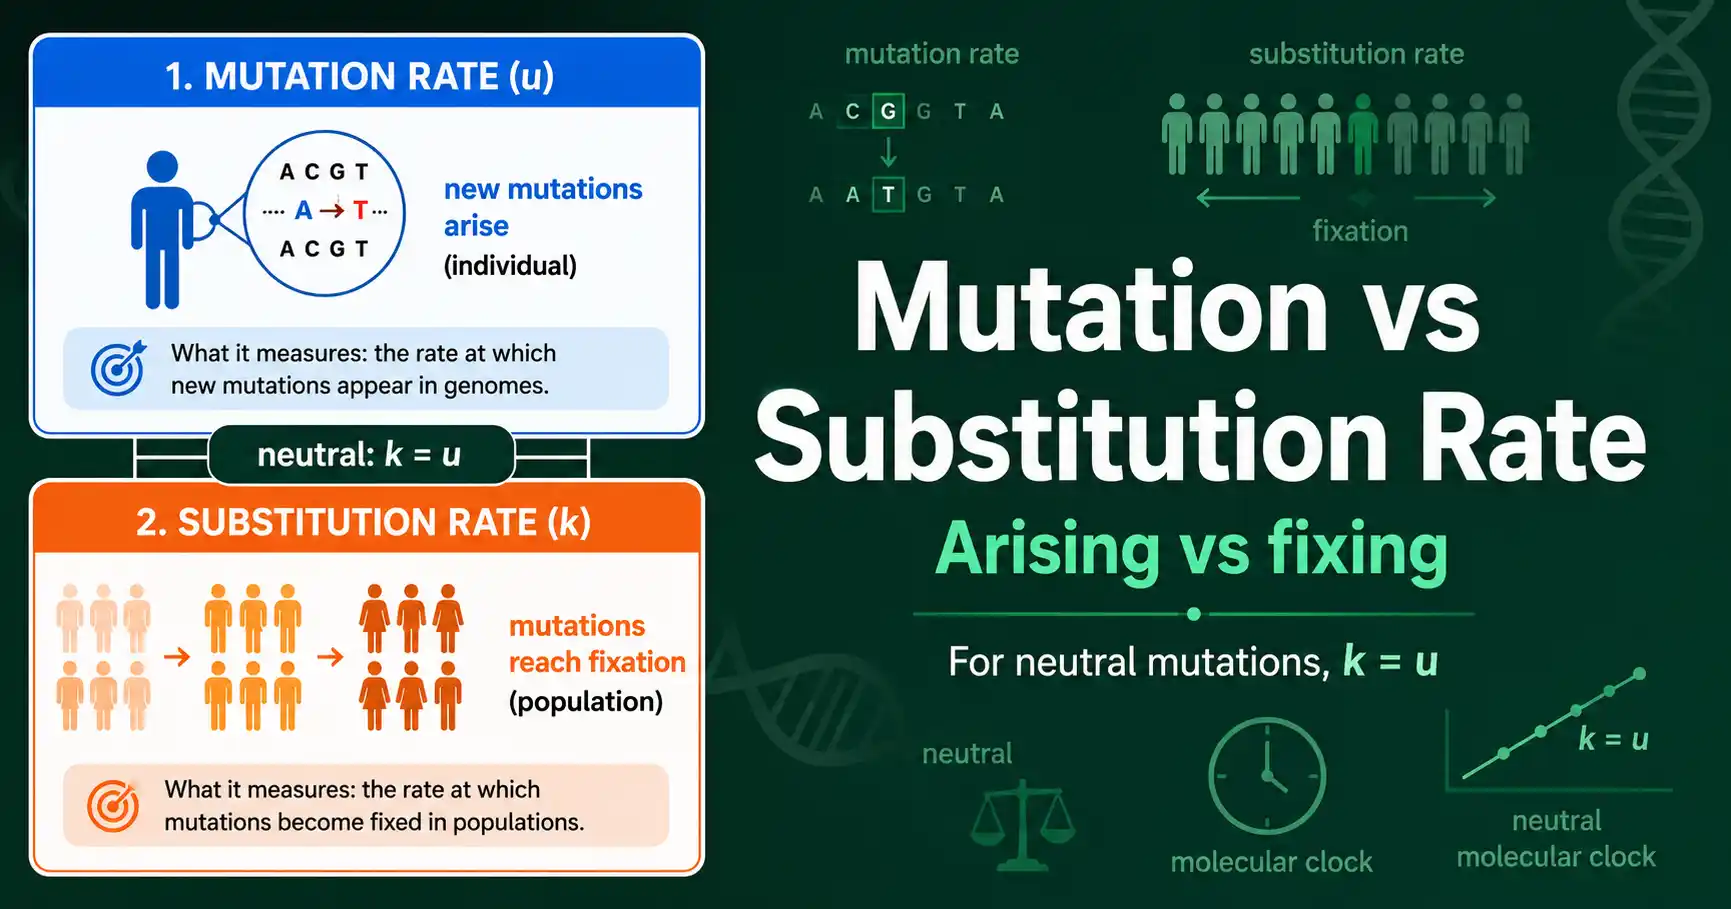
Mutation rate is how fast new mutations arise; substitution rate is how fast they fix in a population. For neutral alleles they are equal (k = u), the heart of the molecular clock.
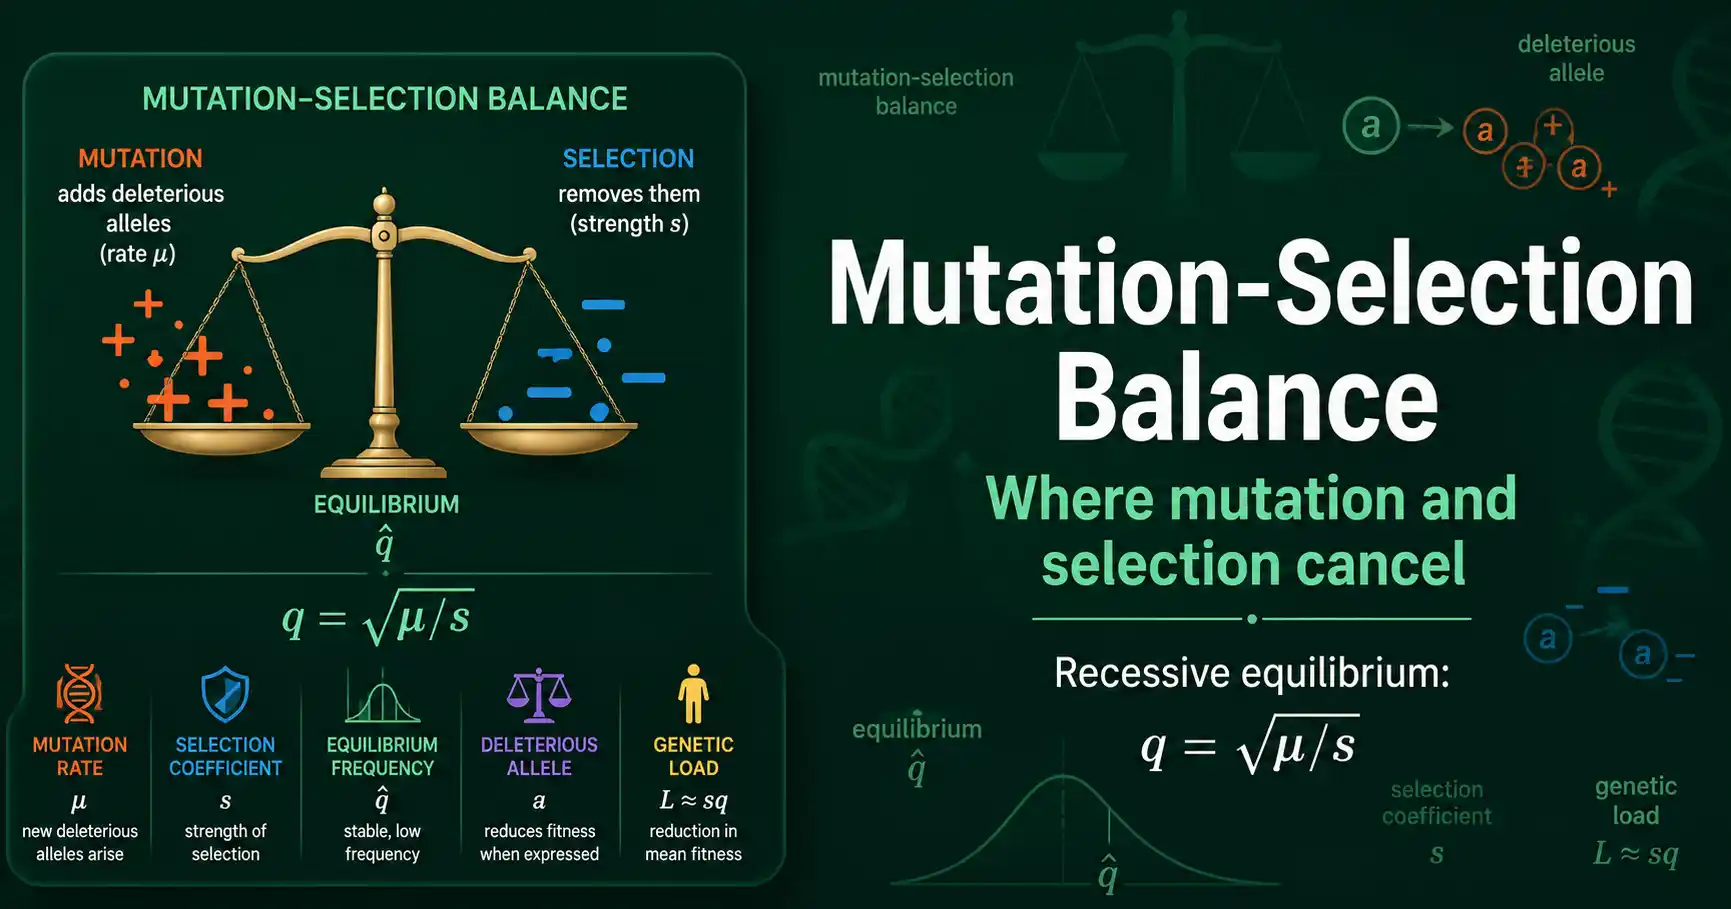
Mutation-selection balance is the equilibrium where mutation adds deleterious alleles as fast as selection removes them. For recessive alleles the frequency settles at q = sqrt(mu/s).
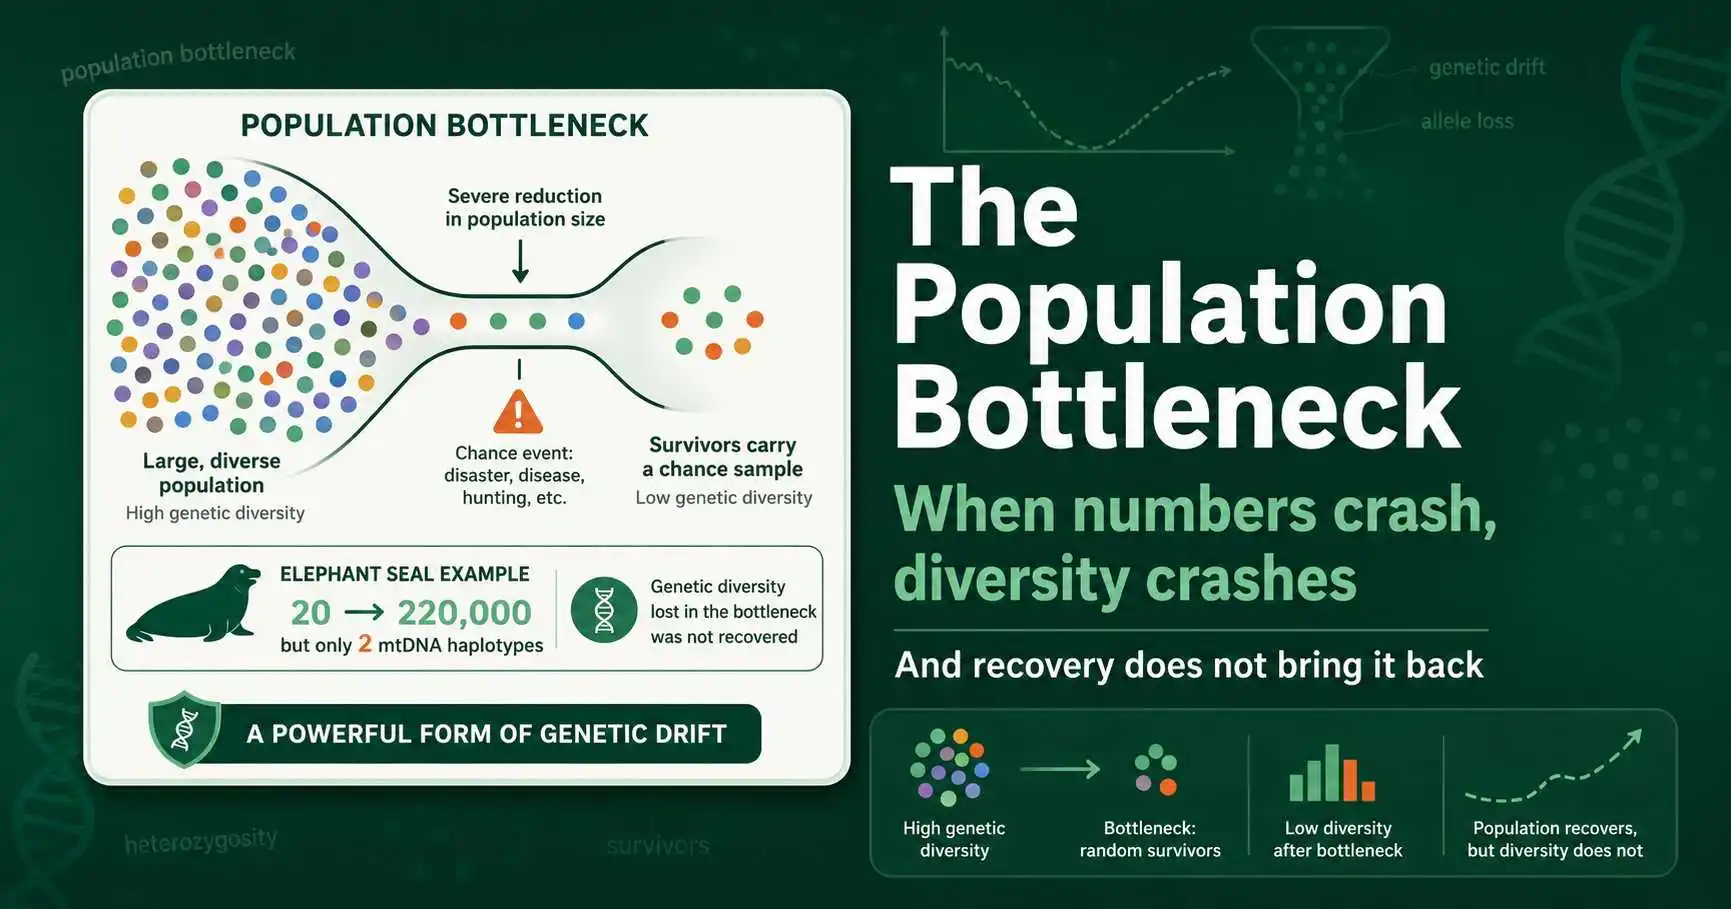
A population bottleneck is a sharp drop in population size that slashes genetic diversity. See real examples like the northern elephant seal and cheetah, with data and statistics.
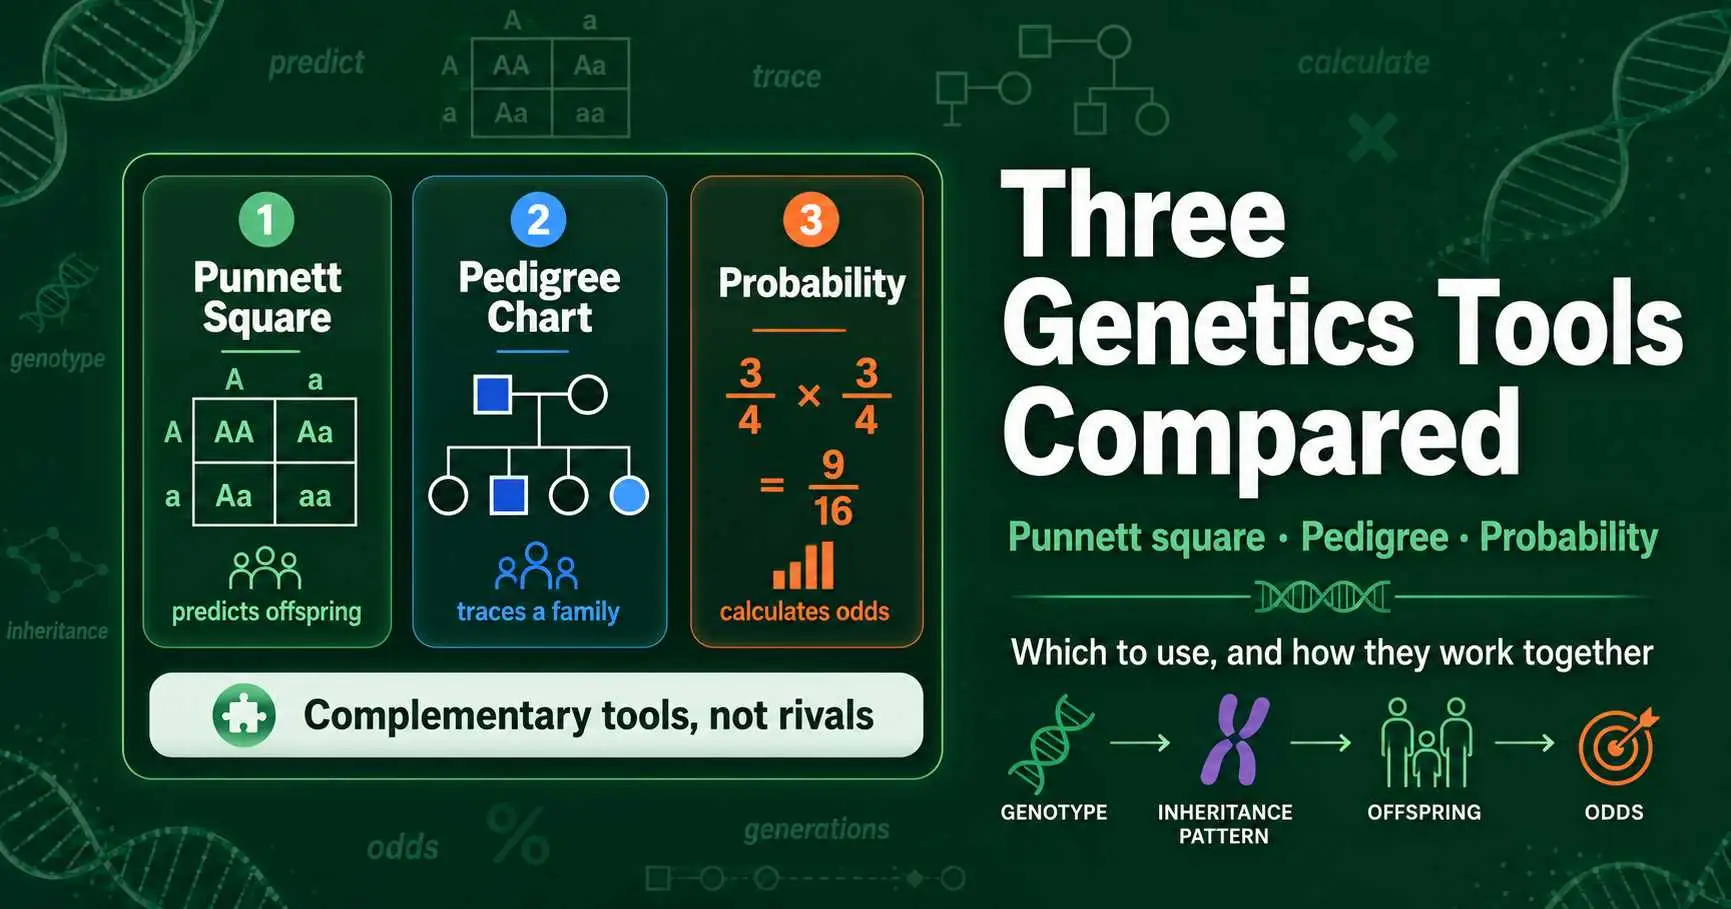
Punnett square vs pedigree chart vs probability method: what each genetics tool does, when to use it, and how they work together to predict and trace inheritance.
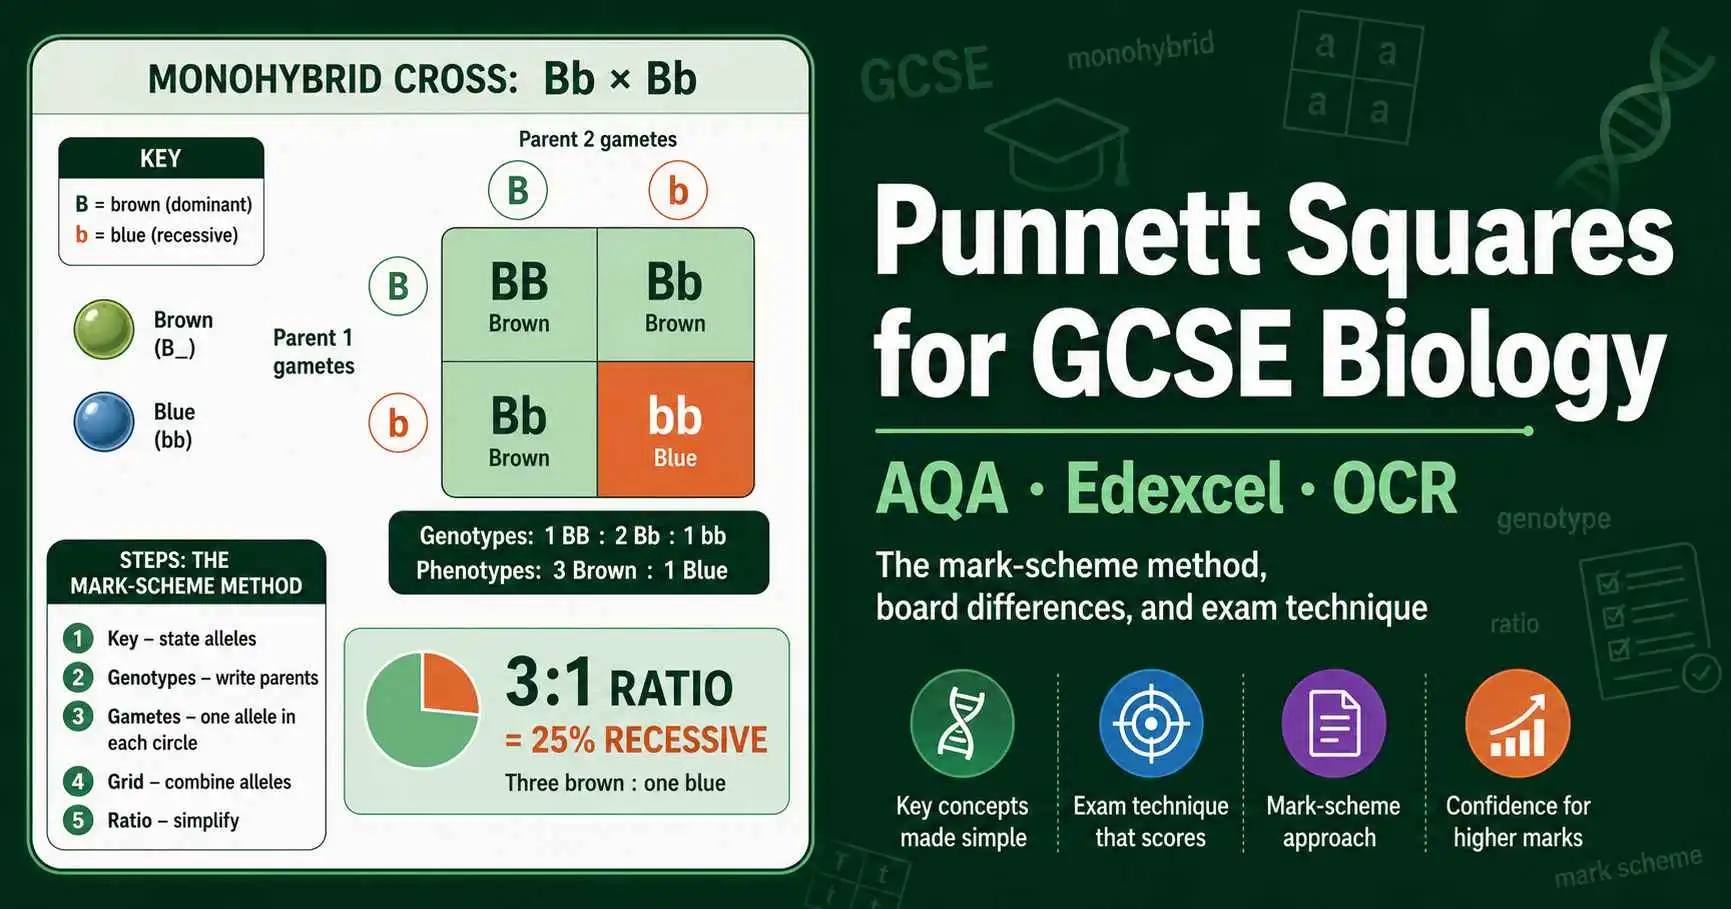
Master Punnett squares for GCSE Biology. Exam technique, the mark-scheme method, board differences for AQA, Edexcel and OCR, plus worked questions and common mistakes.
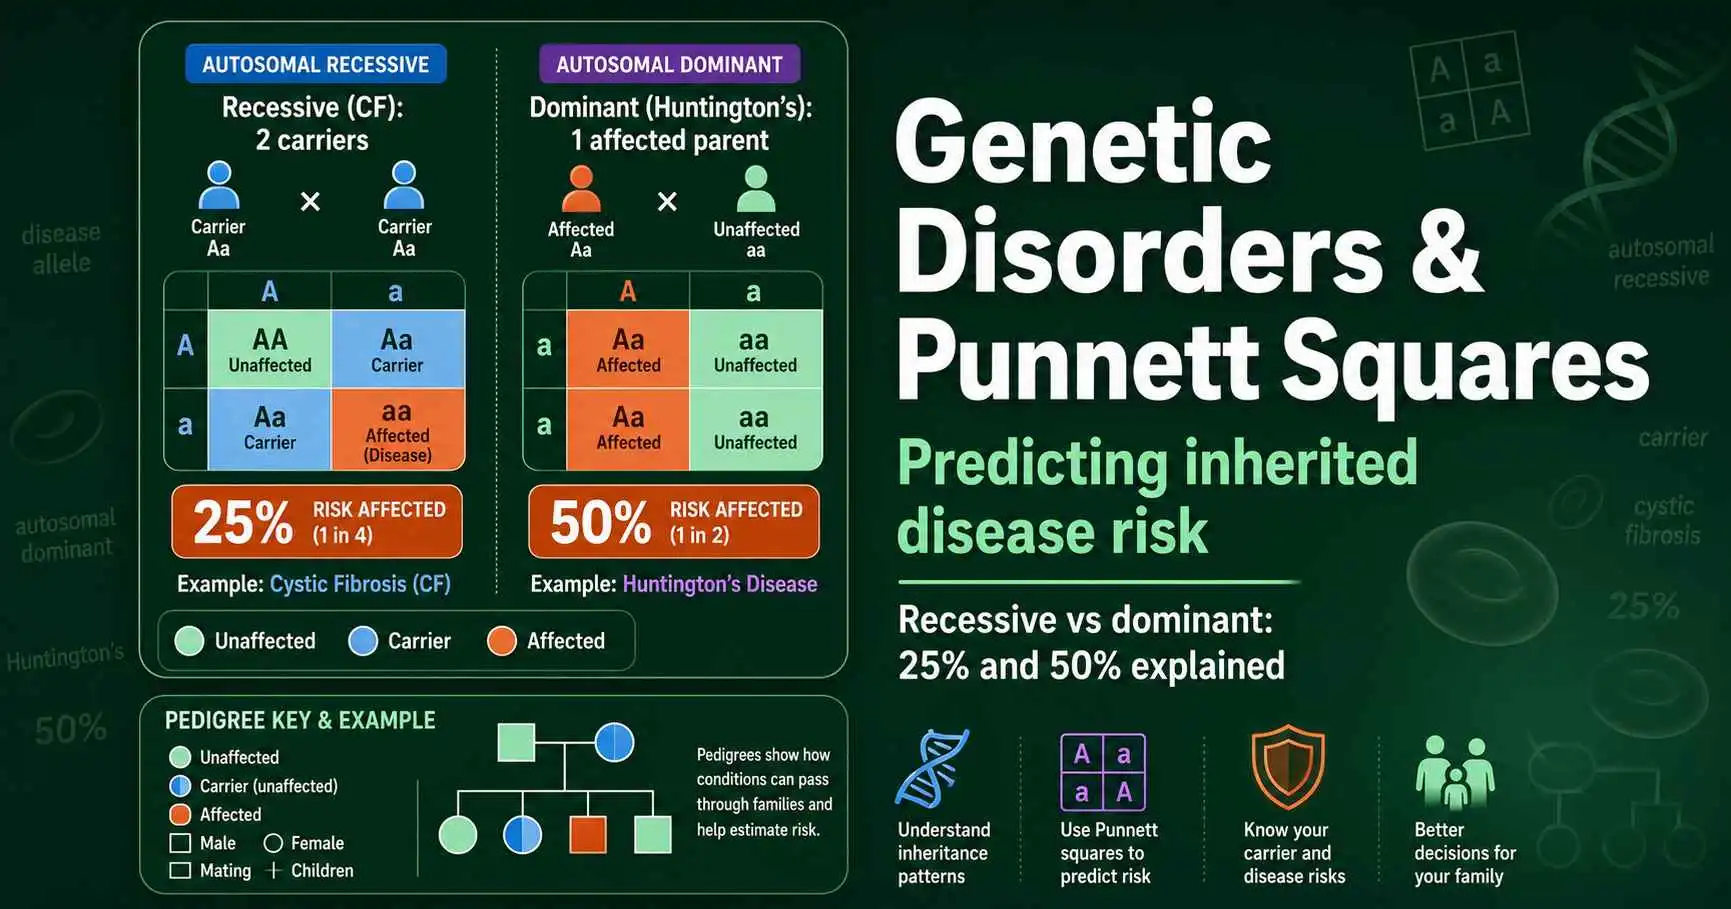
How Punnett squares predict genetic disorder risk. Covers autosomal recessive (cystic fibrosis), autosomal dominant (Huntington's), and X-linked patterns with clear odds.
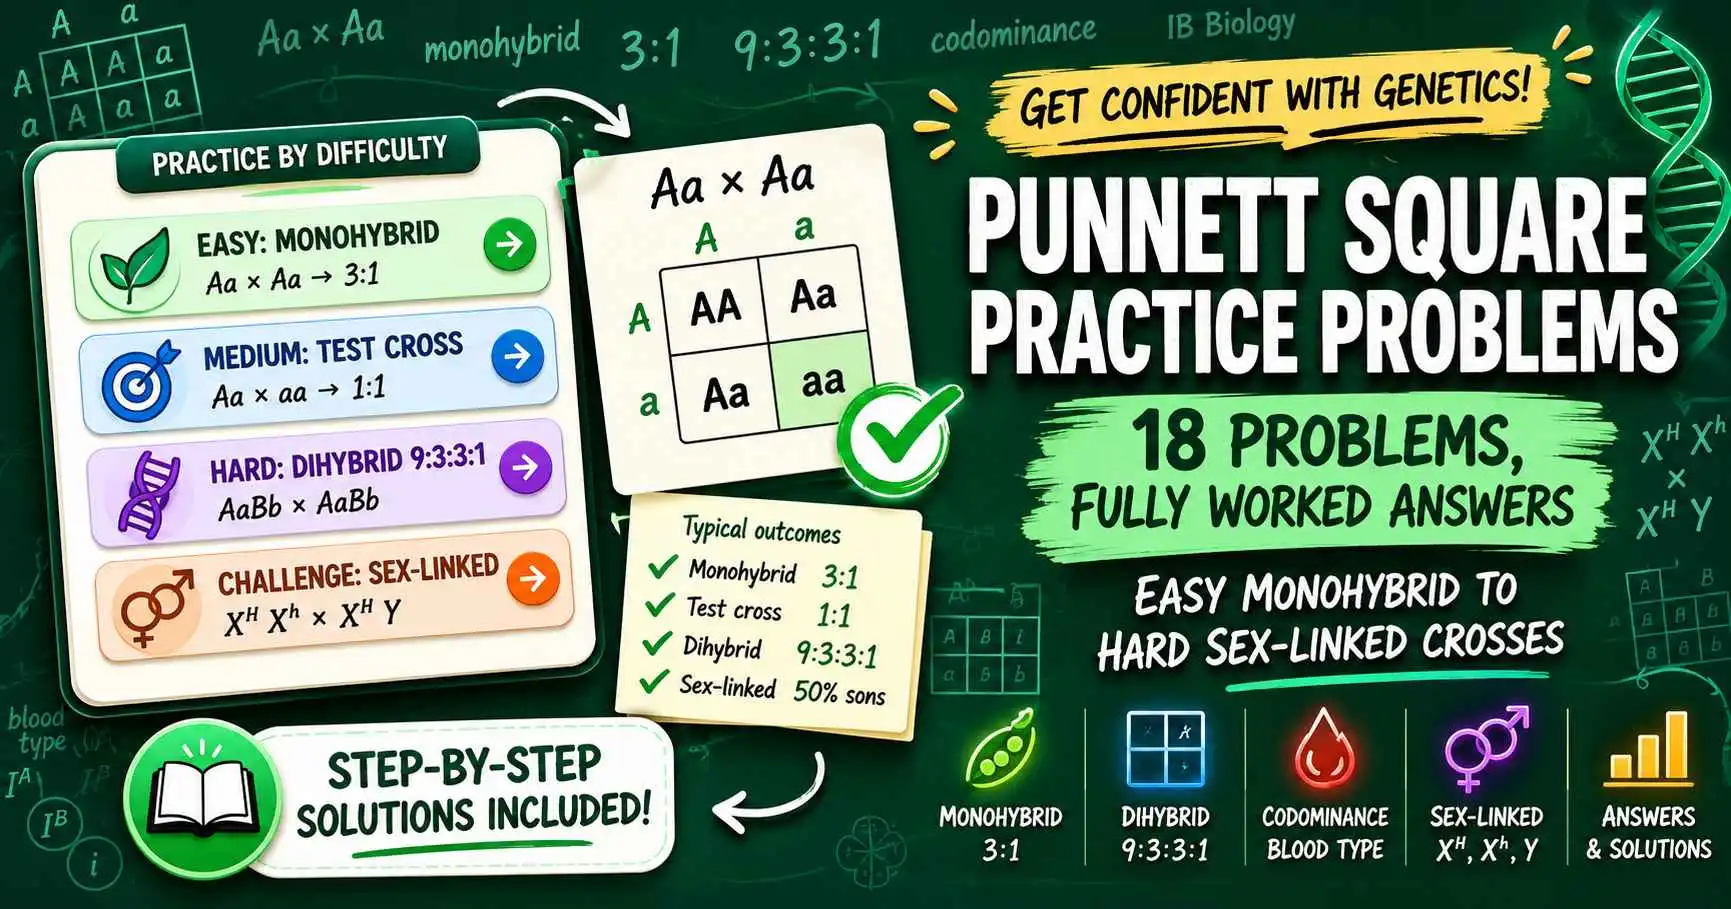
Graded Punnett square practice problems with full worked answers, from easy monohybrid crosses to dihybrid, codominance, sex-linked, and blood type questions.
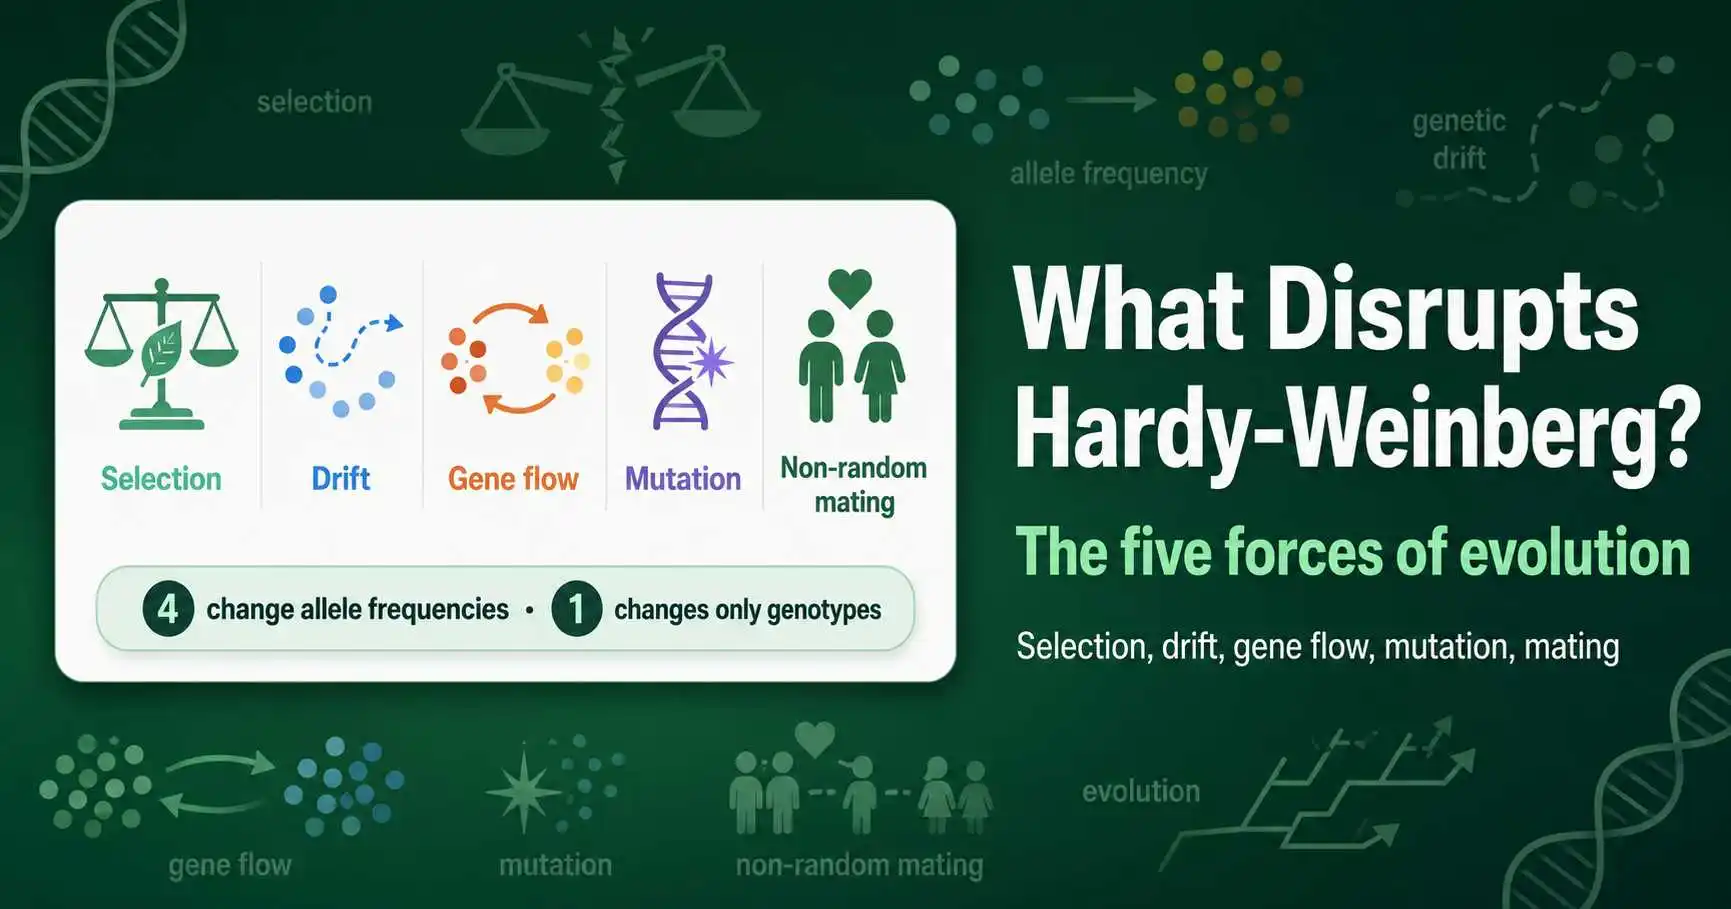
What disrupts Hardy-Weinberg equilibrium: the five forces of mutation, gene flow, genetic drift, non-random mating, and natural selection, with real-world examples.
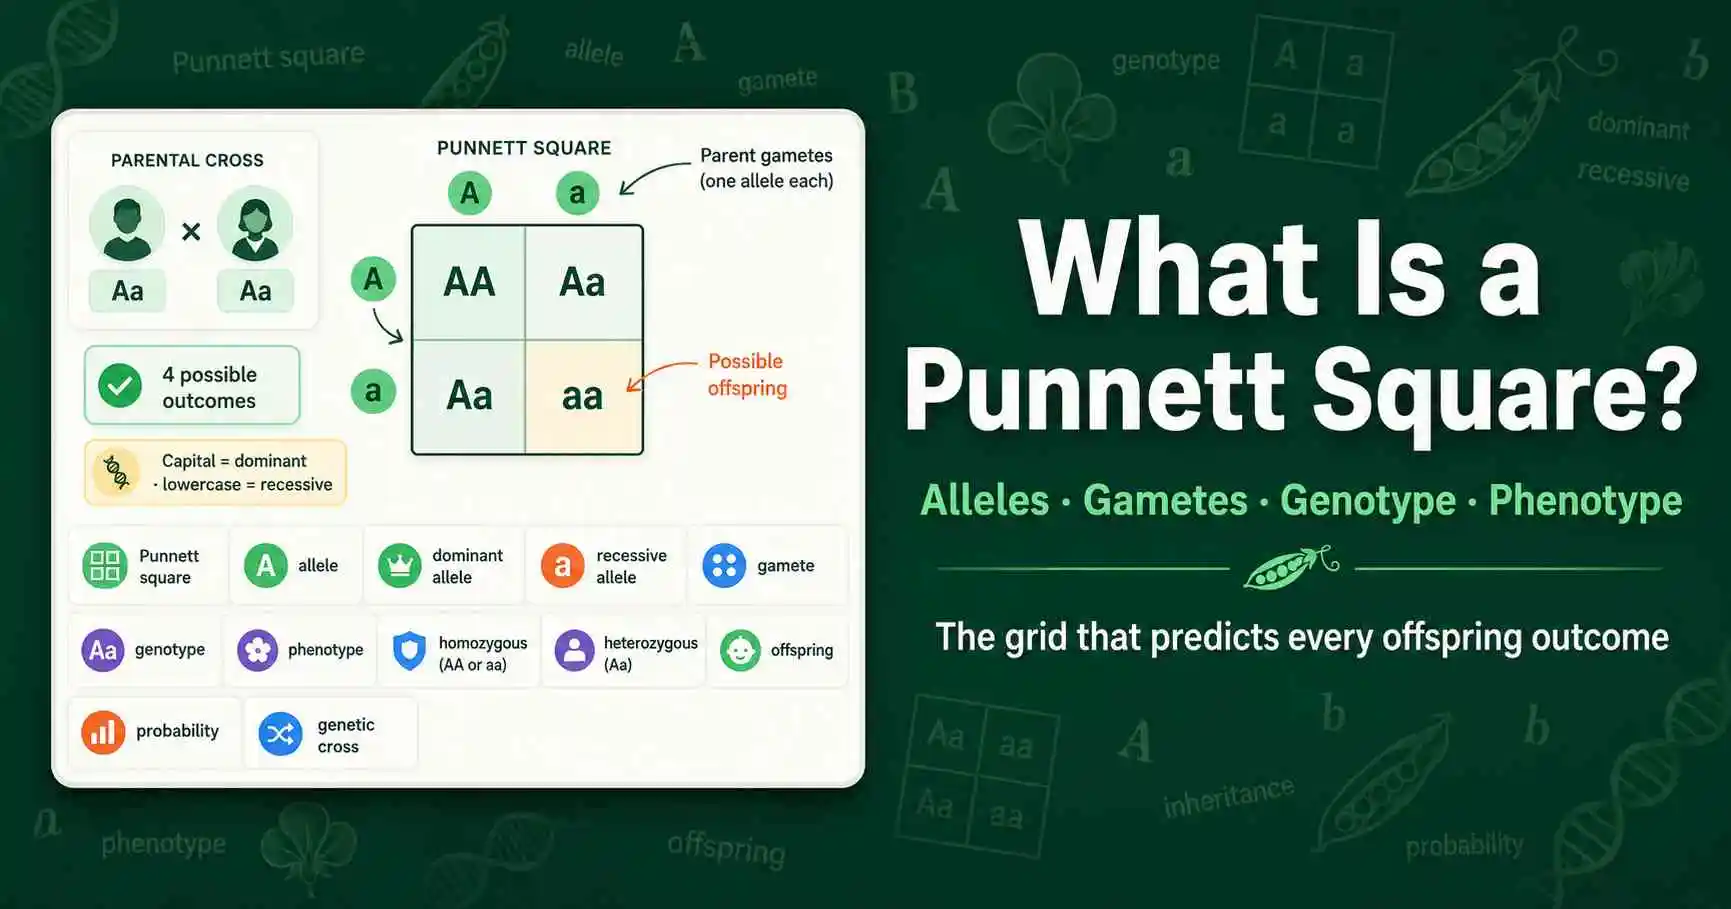
A Punnett square is a grid that predicts offspring genotypes and phenotypes from a genetic cross. Learn its parts, history, and how to read one, with examples.
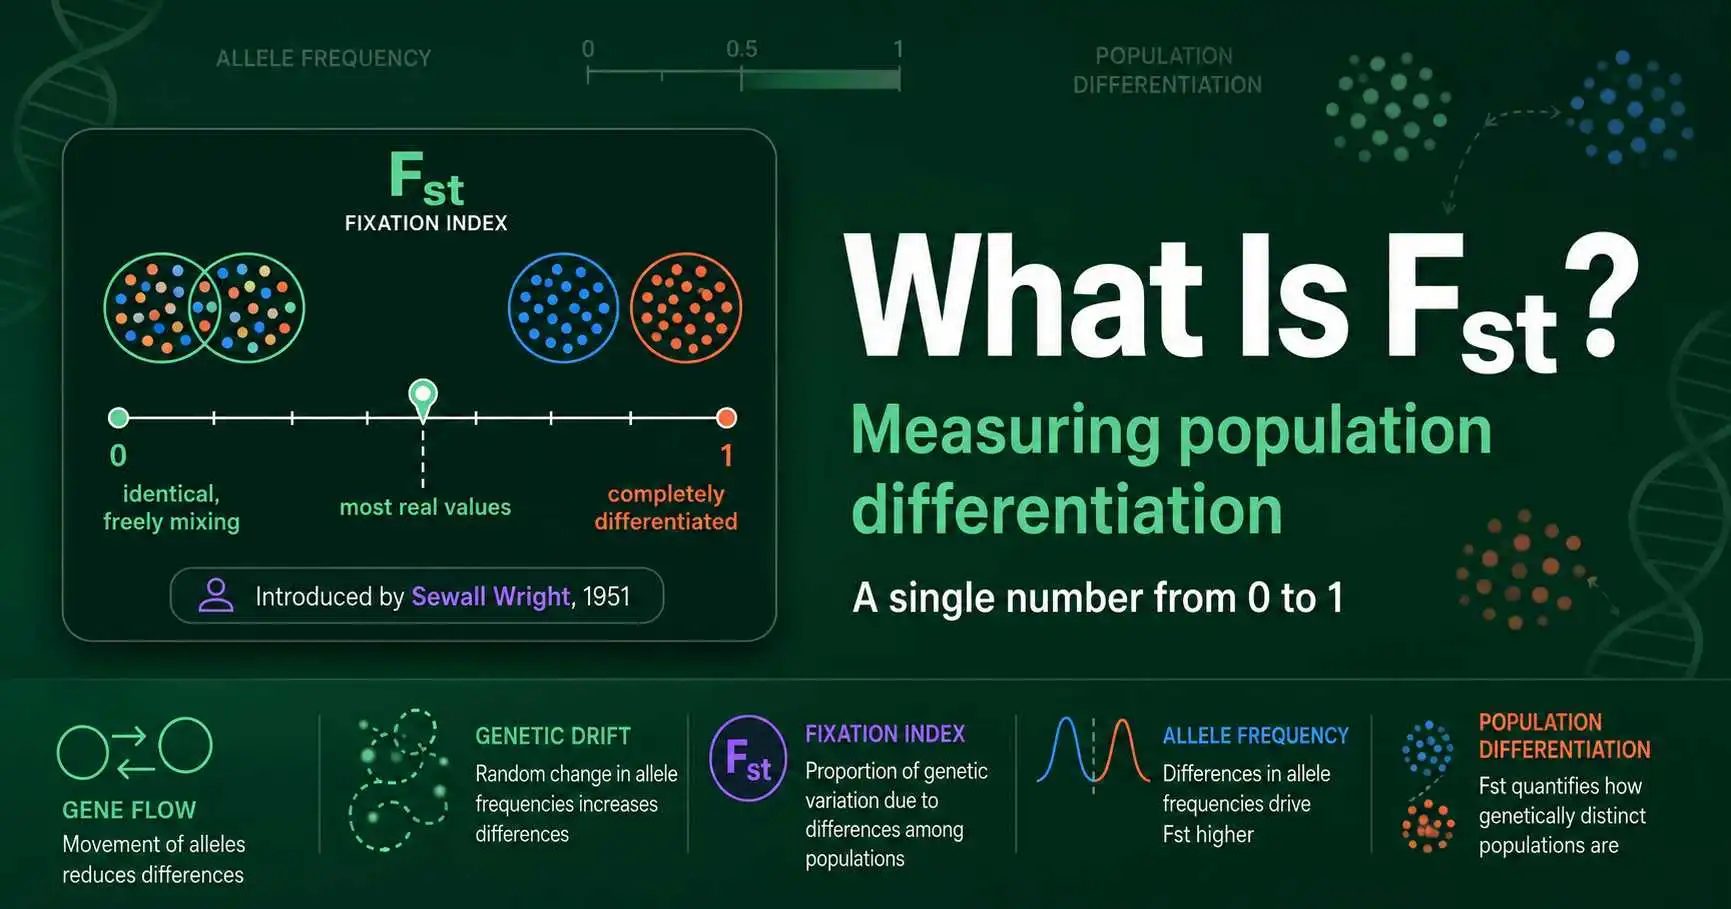
Fst measures how genetically different populations are, on a scale from 0 to 1. Learn what it means, where it came from, and how to read it, with the science behind it.
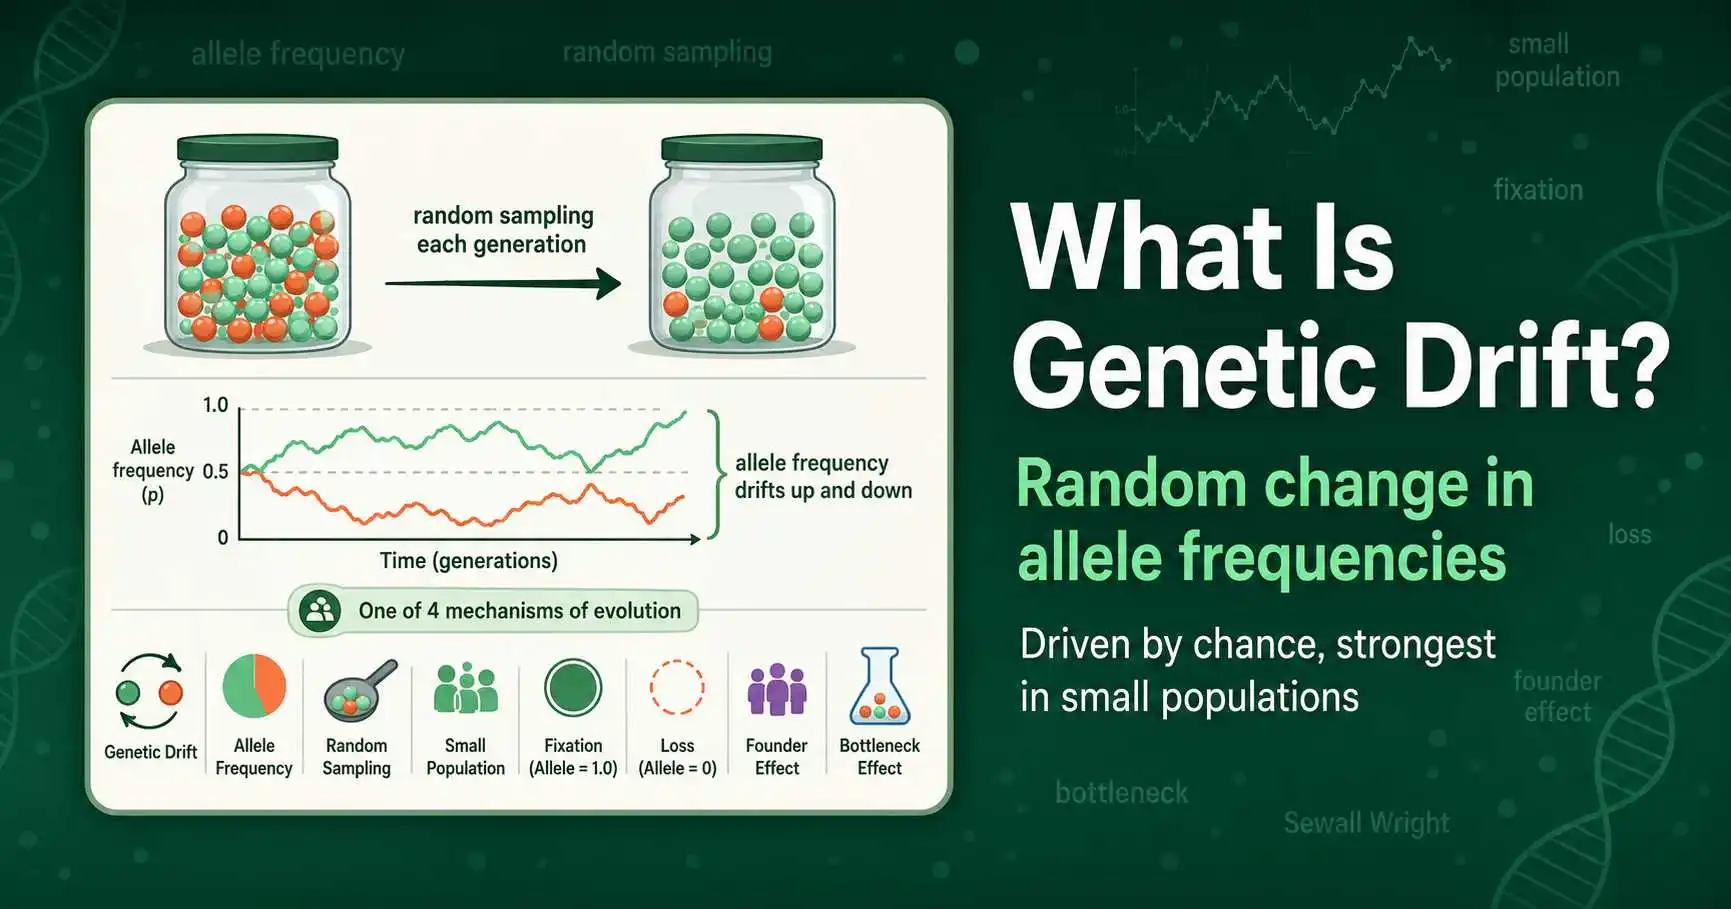
Genetic drift is the random change in allele frequencies in a population over time. Learn its causes, real examples, the founder effect, bottlenecks, and why it matters.
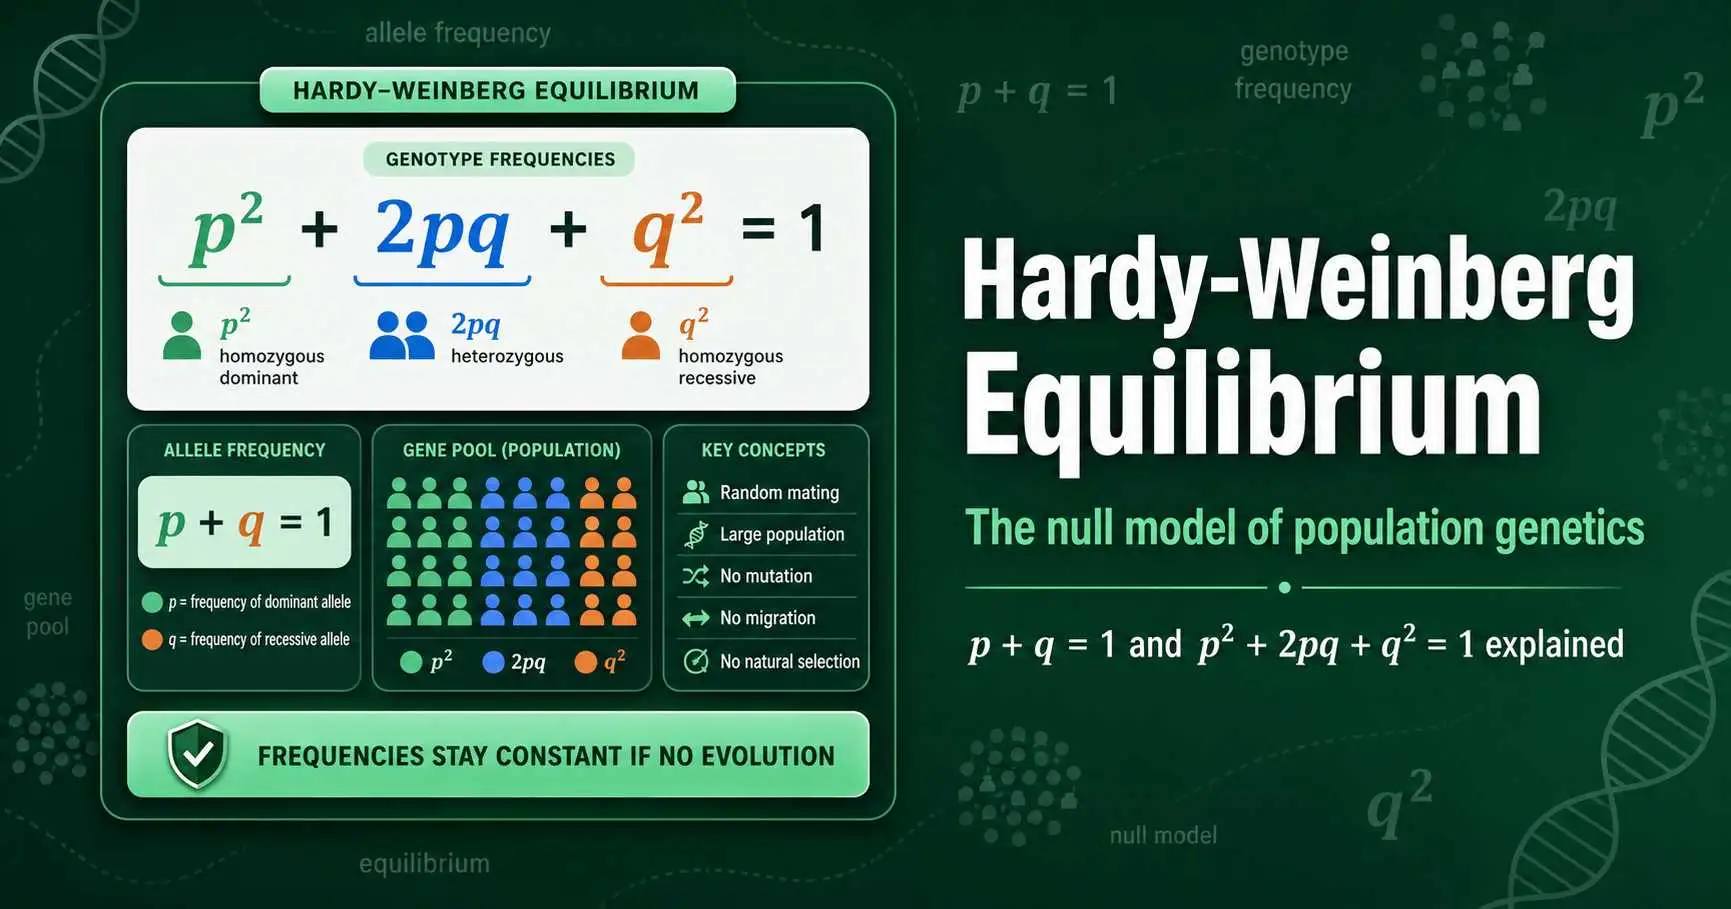
Hardy-Weinberg equilibrium explained: the p + q = 1 and p2 + 2pq + q2 = 1 equations, what they mean, the conditions required, and why it is genetics' null model.
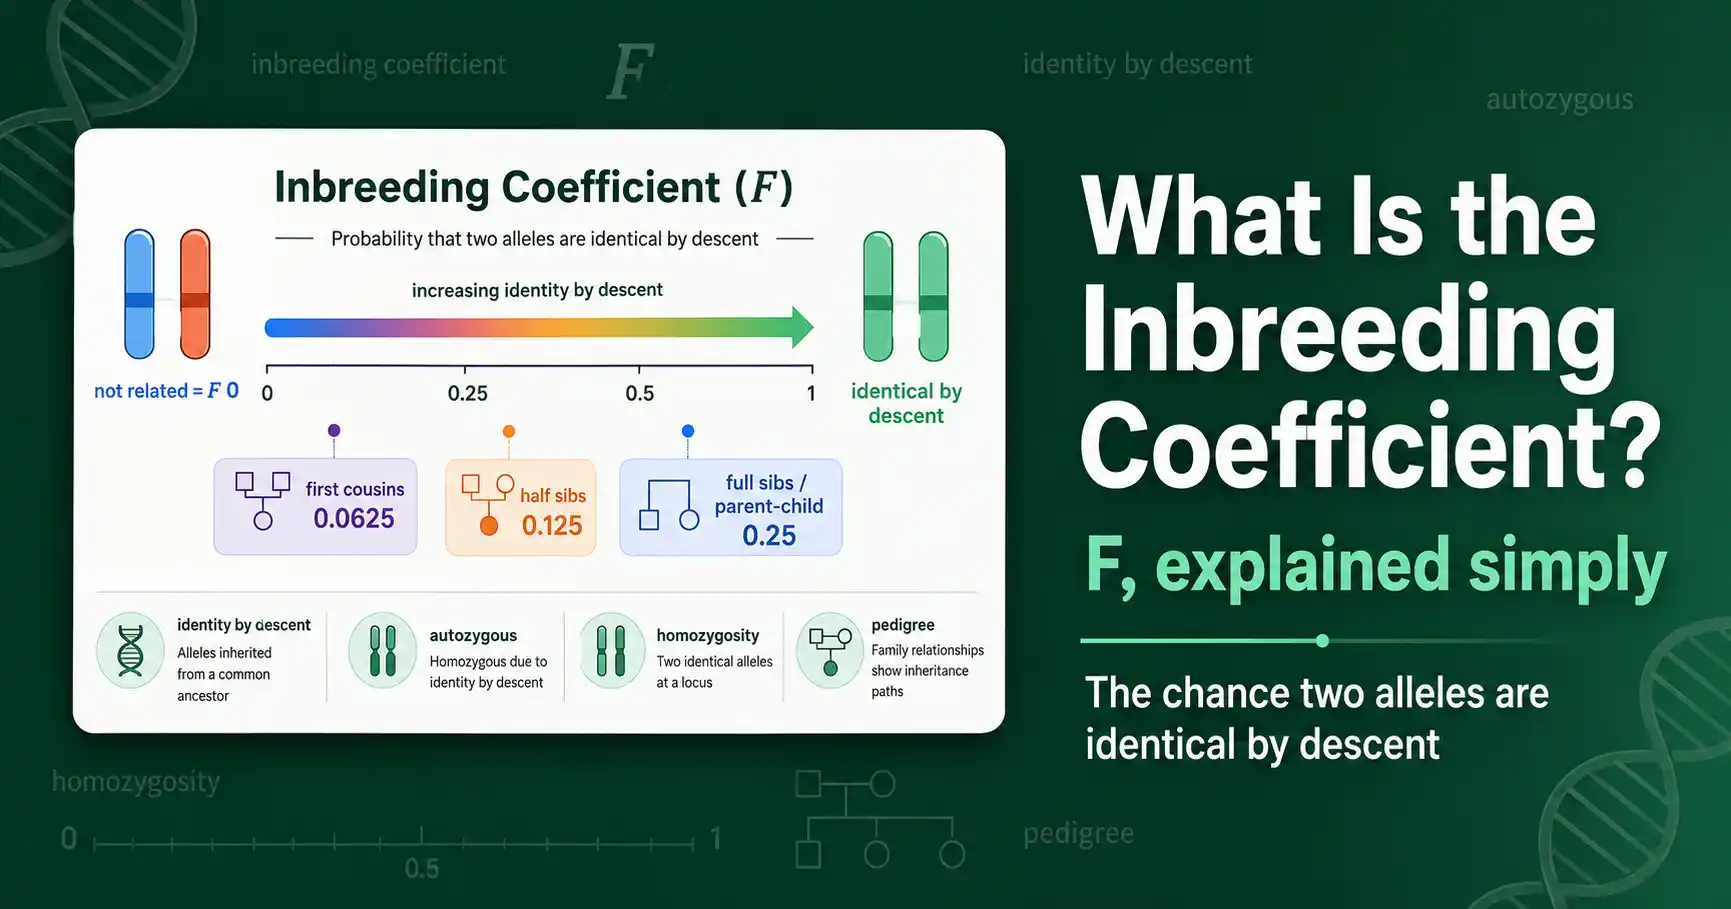
The inbreeding coefficient (F) is the probability that an individual's two alleles at a gene are identical by descent. Here is what F means, how it scales, and why it matters.
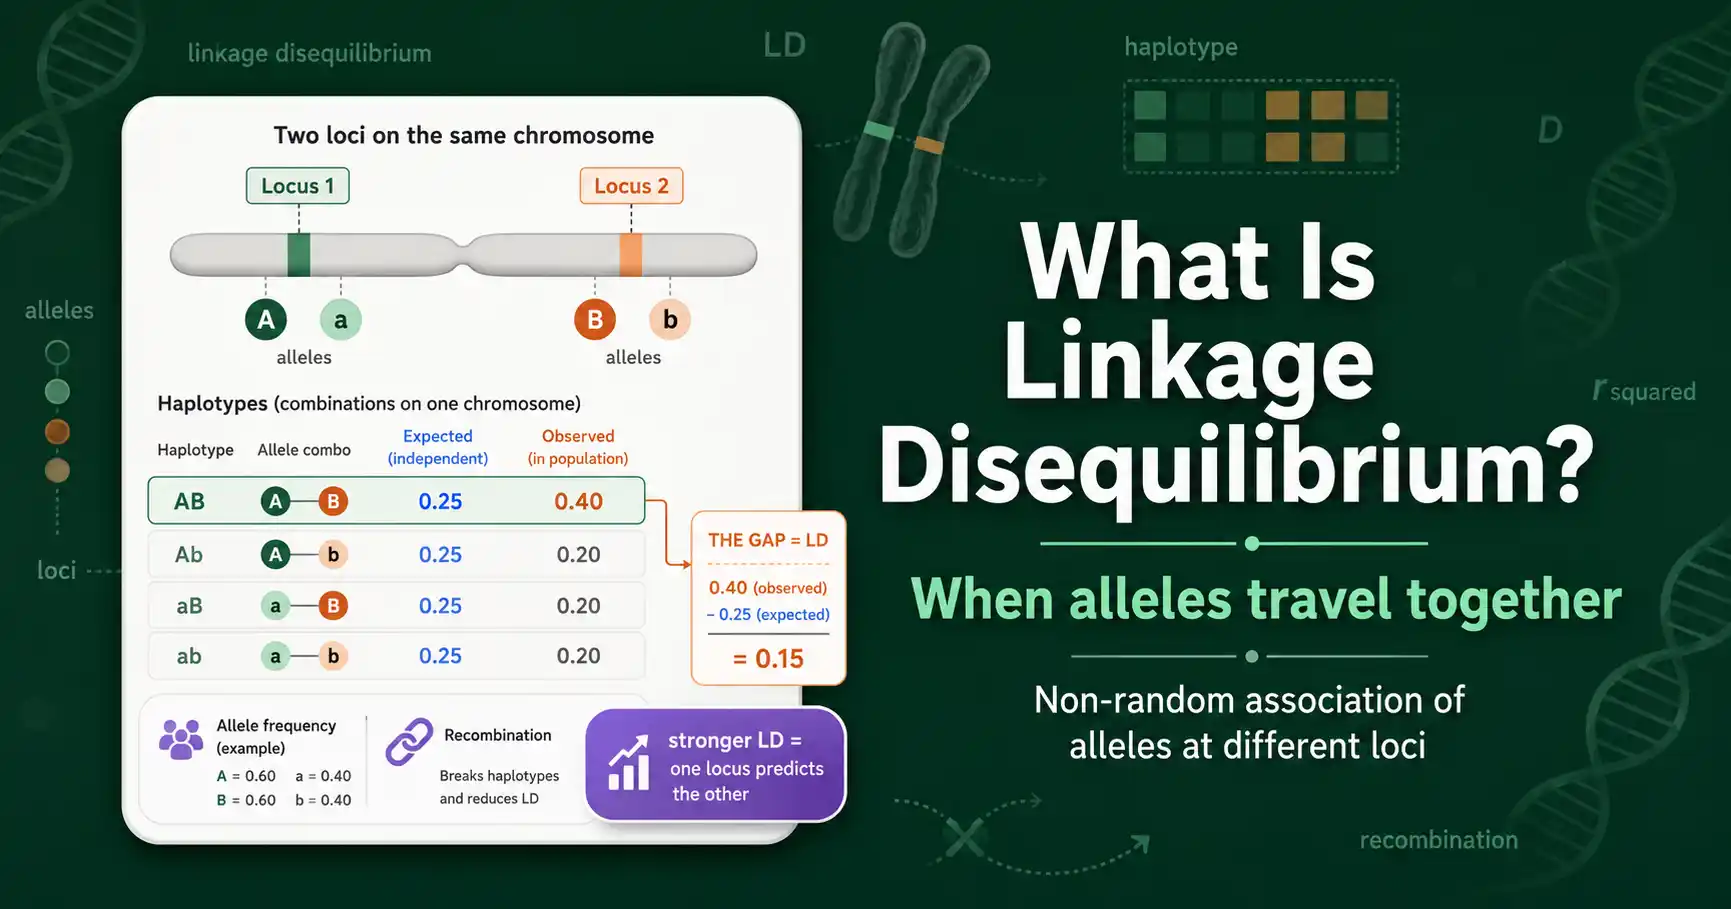
Linkage disequilibrium (LD) is the non-random association of alleles at different loci. Learn what LD means, how it differs from linkage, and why it matters in genetics.
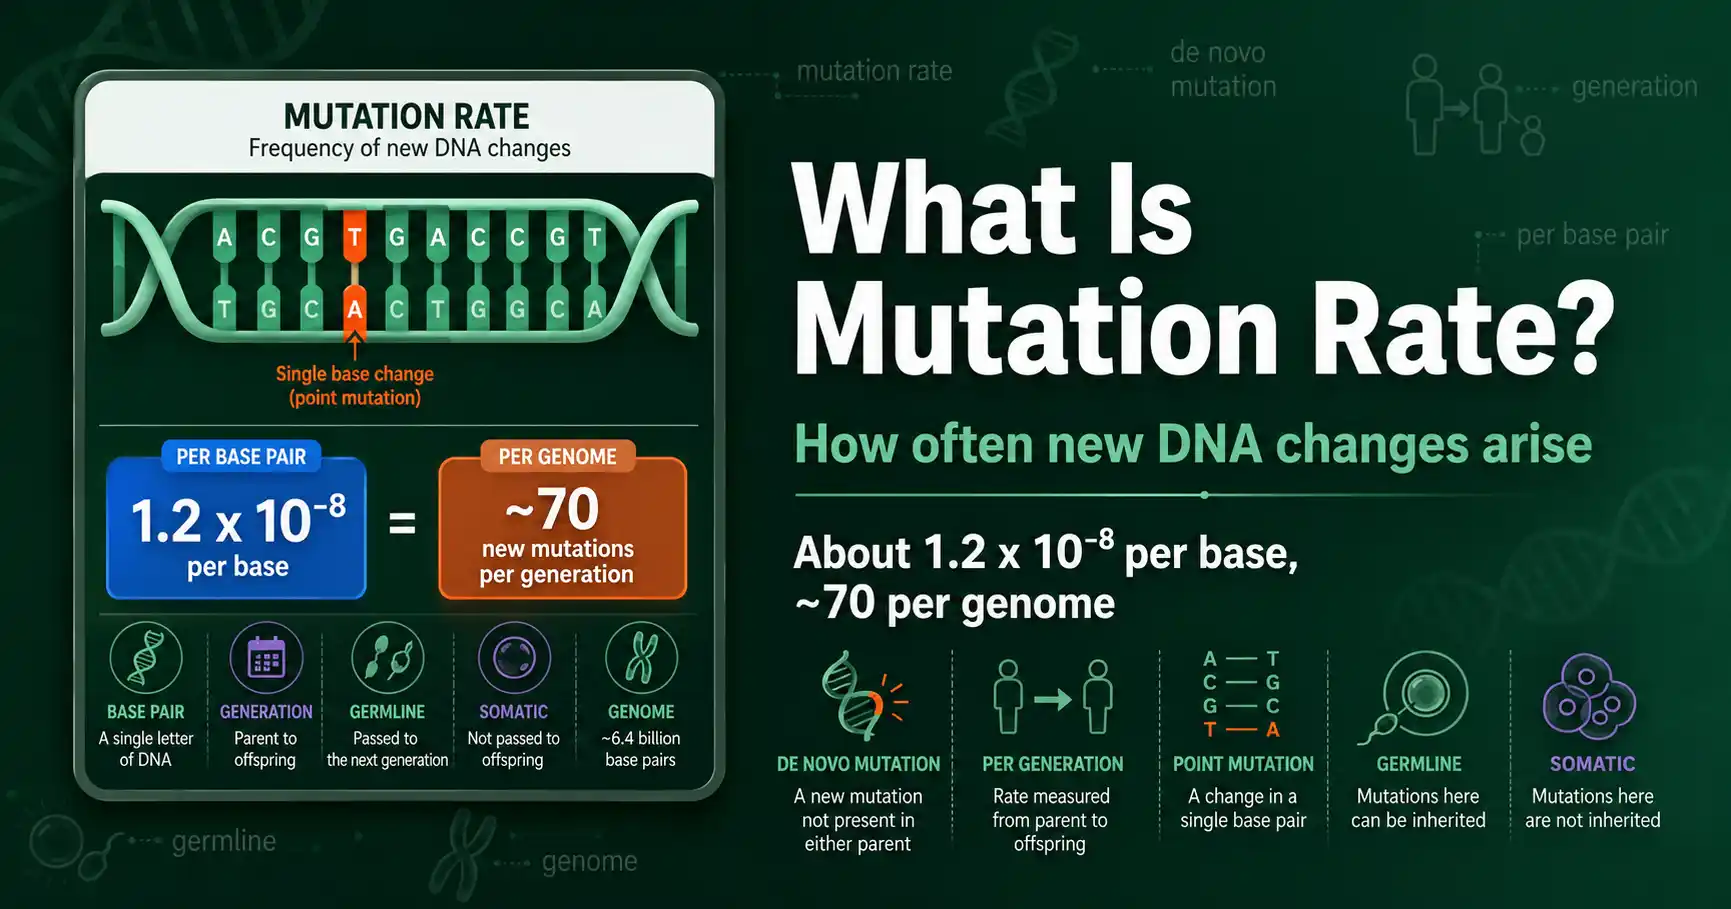
Mutation rate is how often new genetic changes arise, usually per base pair per generation. Learn what mutation rate means, how it is measured, and the human rate of about 1.2 x 10^-8.
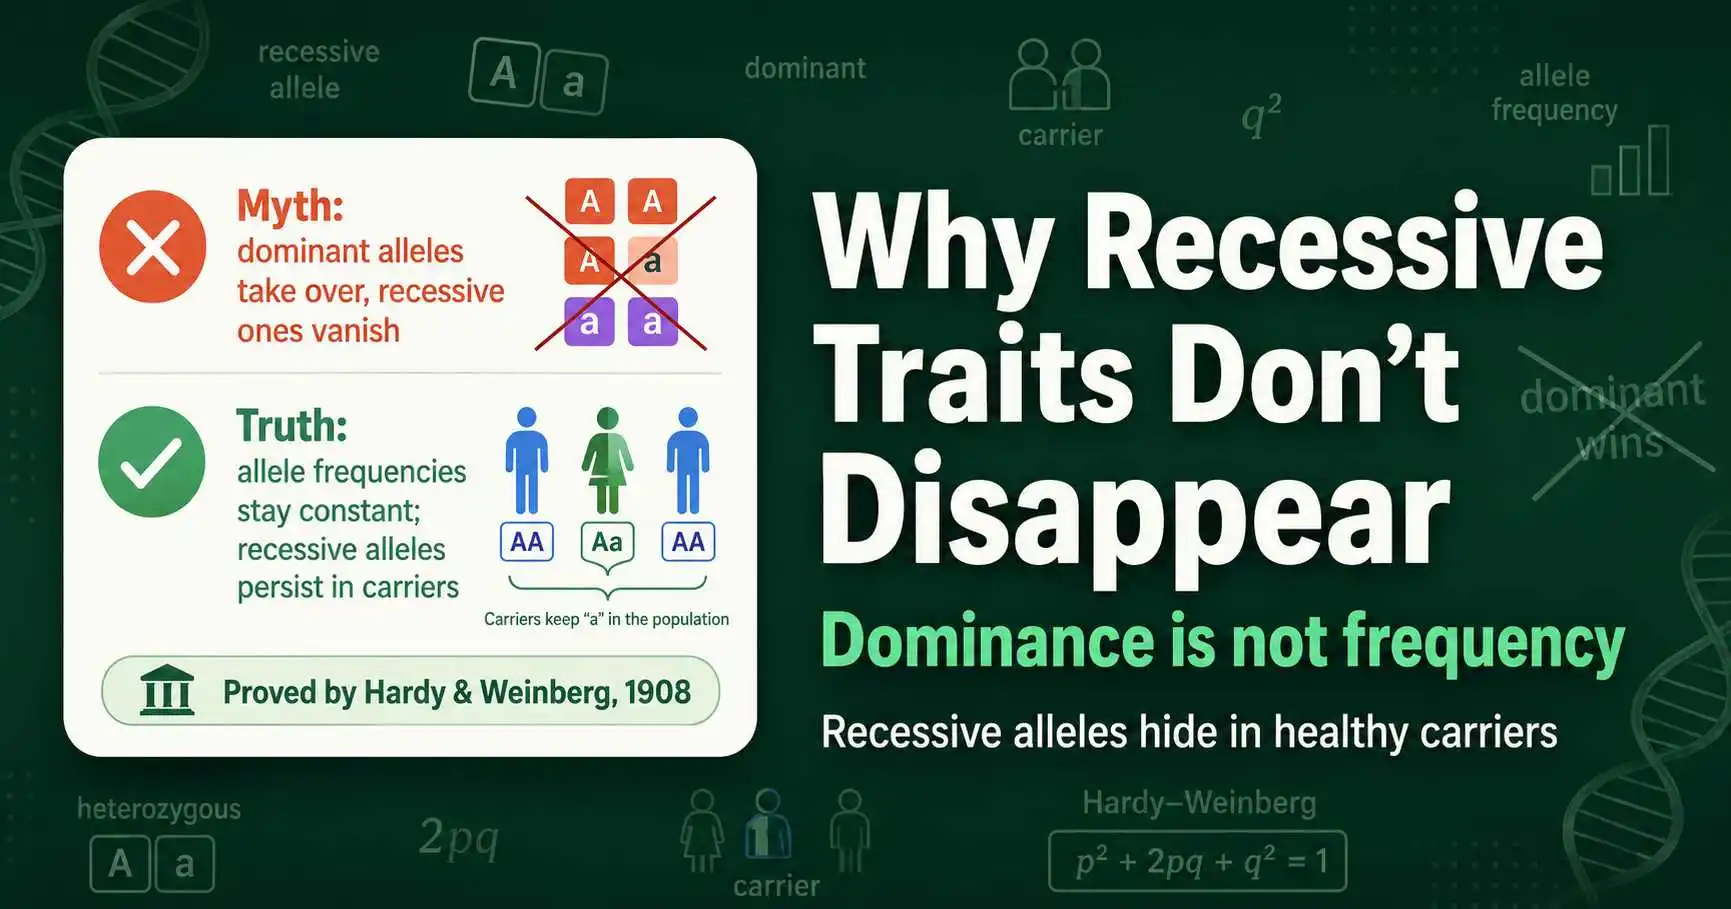
Why don't recessive traits disappear? Because dominance is not frequency, recessive alleles hide in carriers, and Hardy-Weinberg shows allele frequencies stay constant.
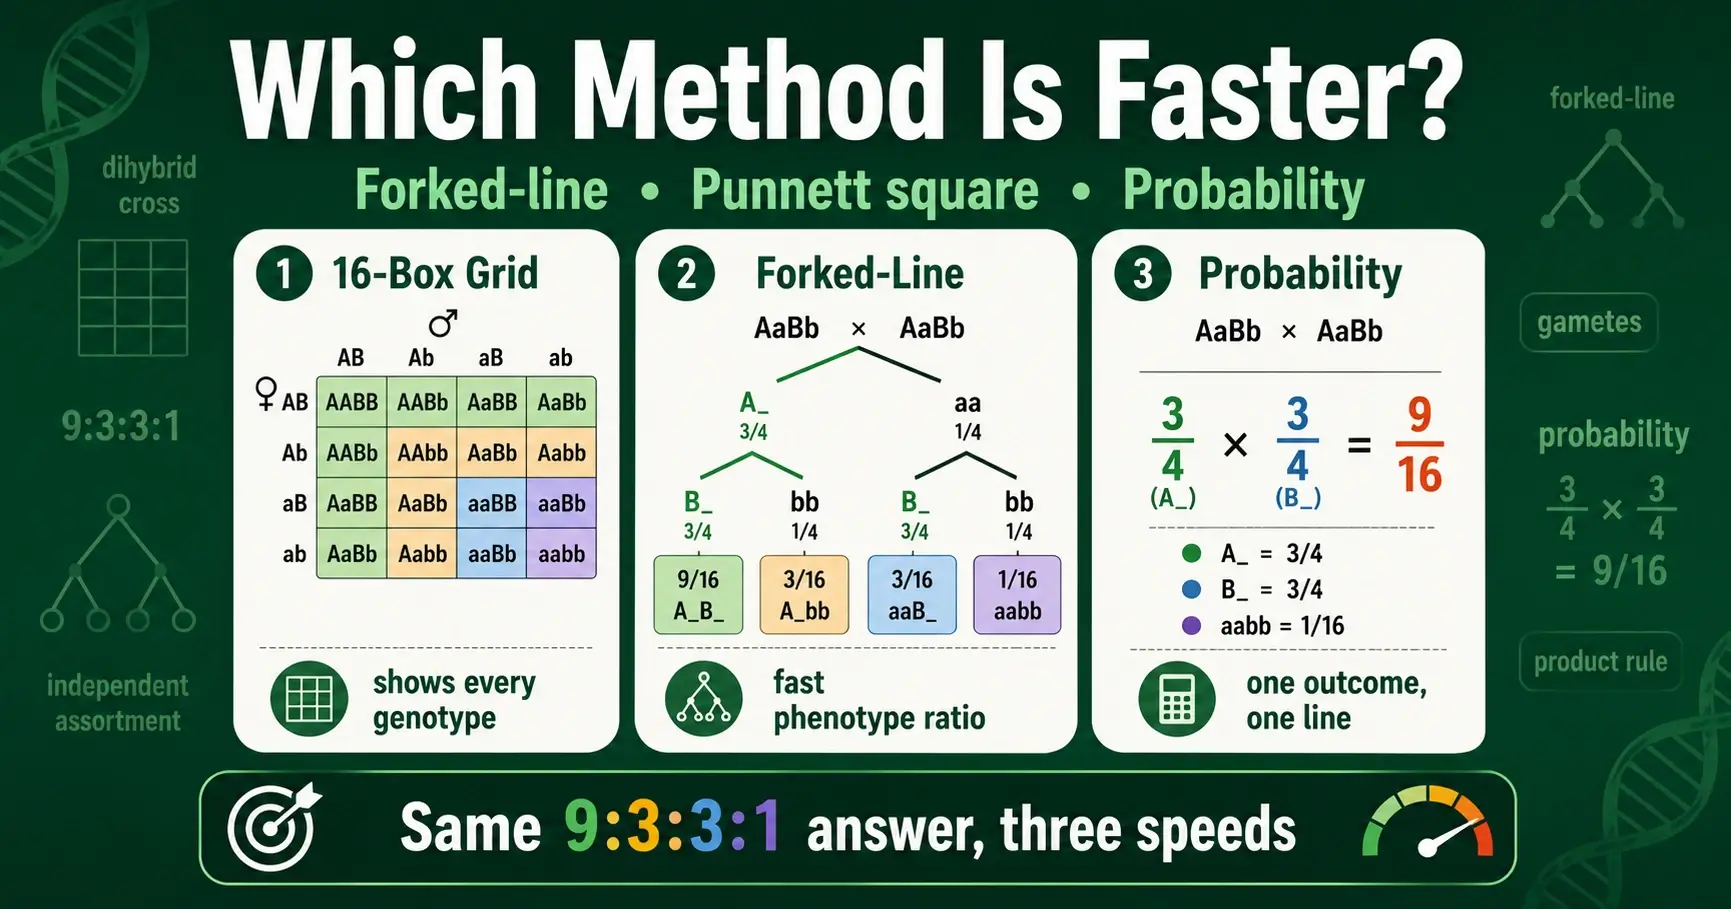
Compare the forked-line method, the 16-box Punnett square, and the probability method for dihybrid crosses. Learn which is fastest and when to use each one.
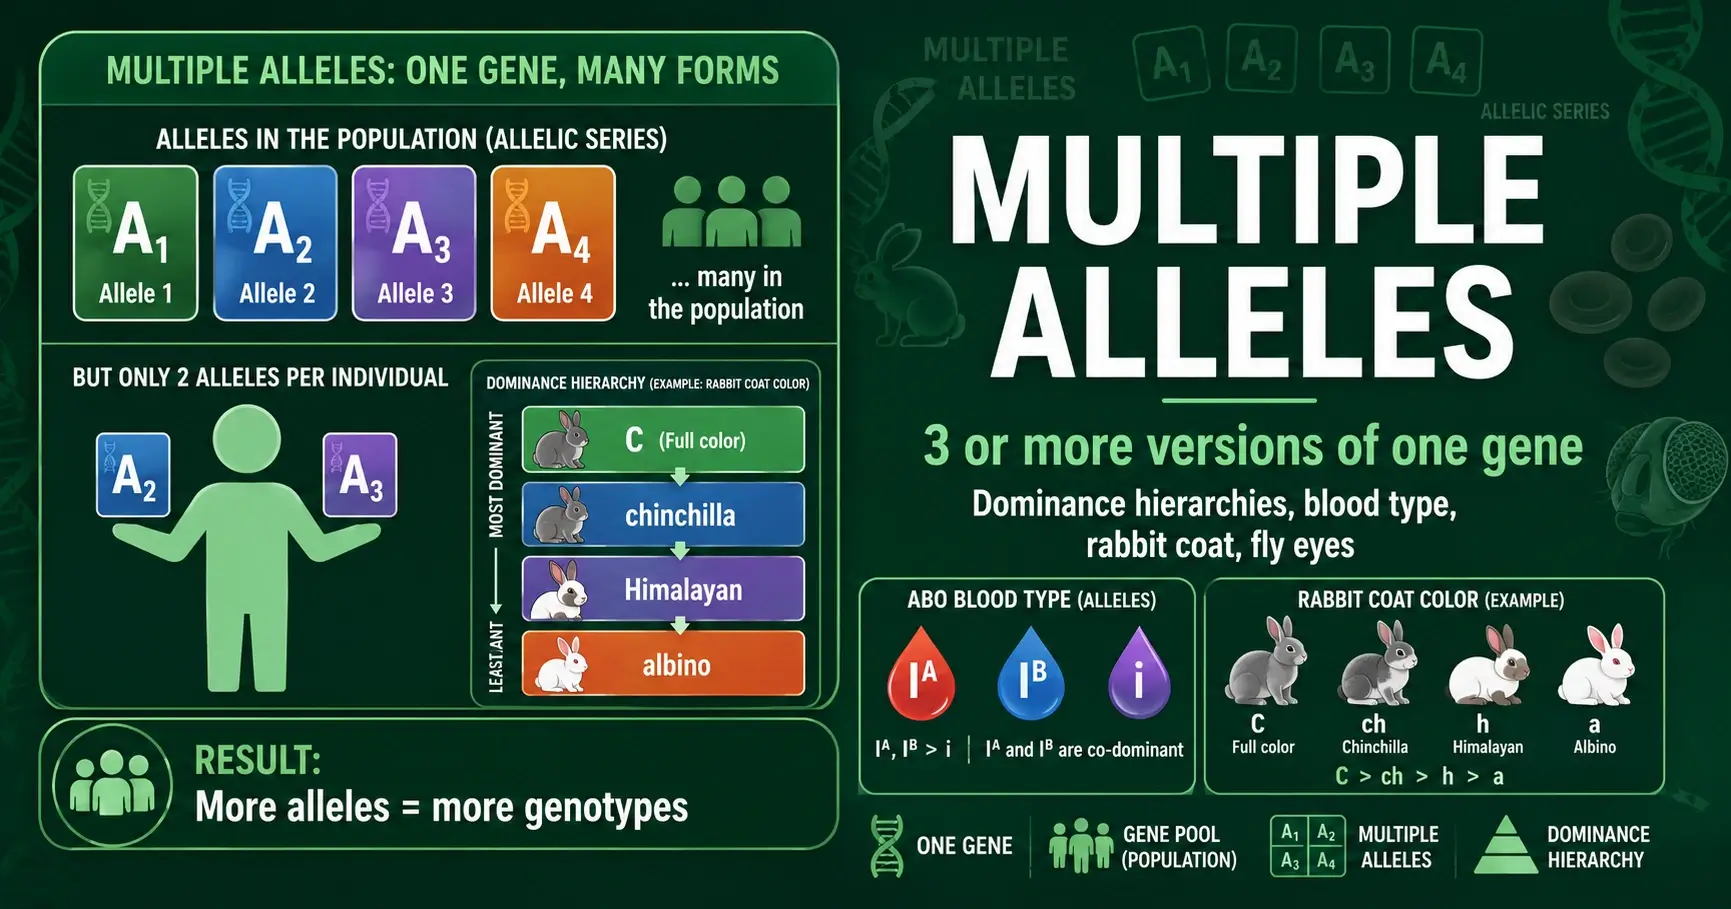
Multiple alleles means a gene has three or more versions in a population. Learn how dominance hierarchies work, with ABO blood type, rabbit coat, and fly eye examples.
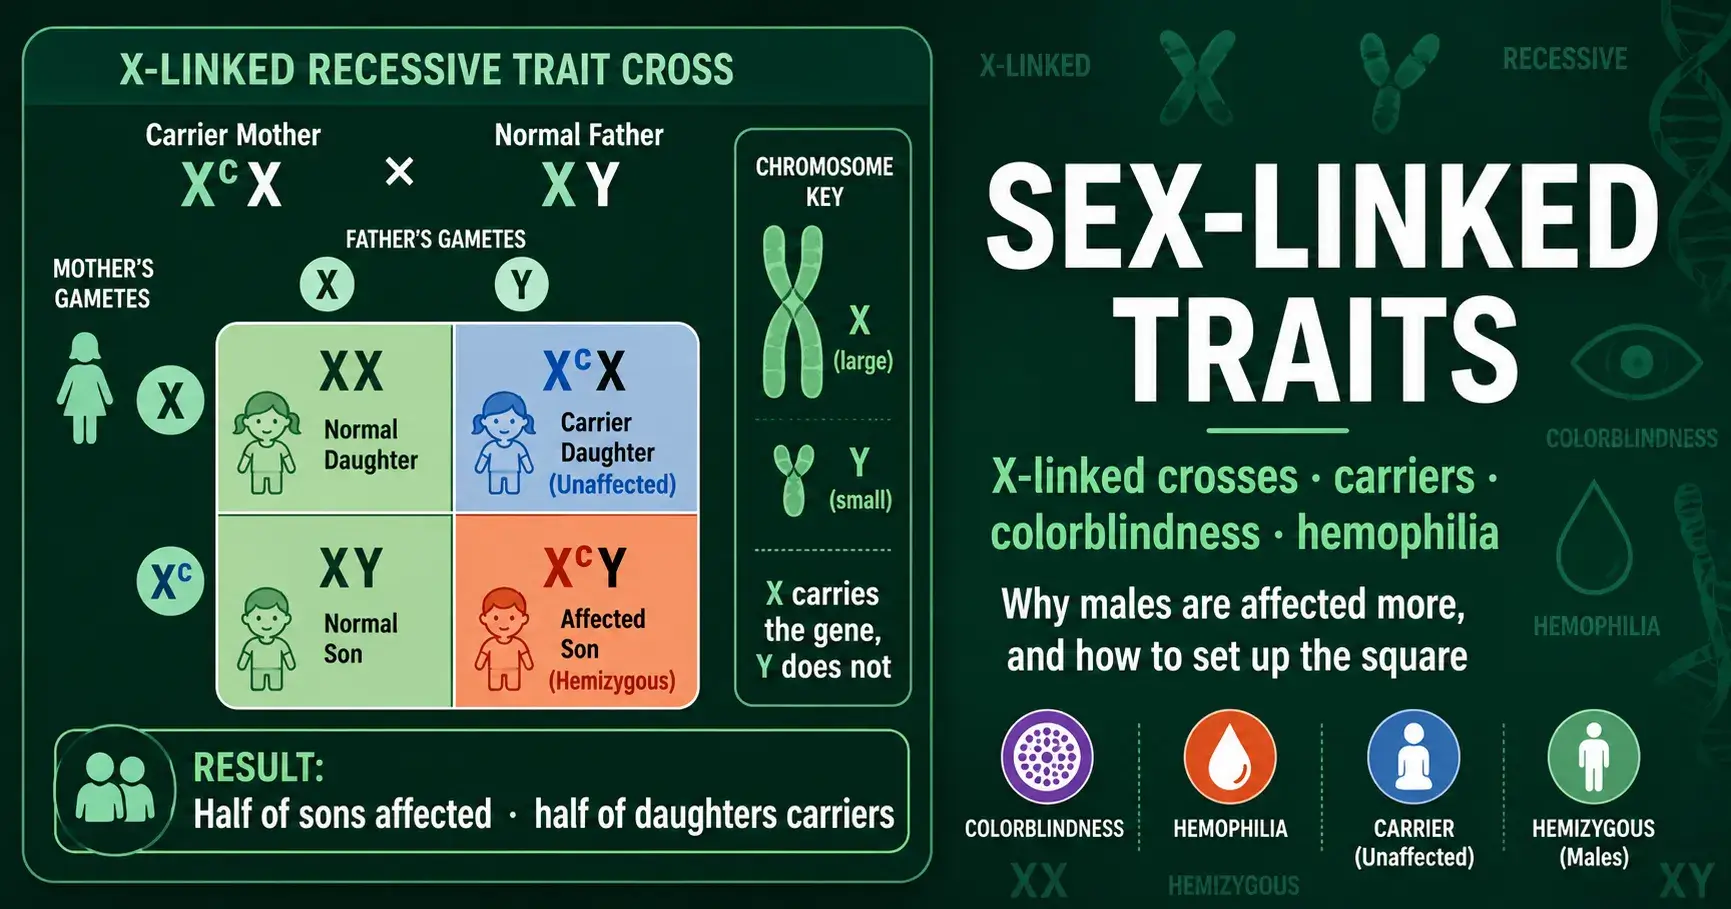
Learn how sex-linked inheritance works and how to build X-linked Punnett squares for colorblindness and hemophilia, including carrier mothers and why males are affected more.