Fst vs Gst vs Jost's D: Differentiation Measures
Read enough population genetics papers and you will hit a wall of similar-looking statistics: Fst, Gst, G'st, and Jost's D, all claiming to measure how different populations are. They are not interchangeable. They can give wildly different values from the very same data, and the disagreements are not errors to be debugged. They reflect a genuine and unresolved split over what the word "differentiation" should even mean.
This guide sorts them out. It explains what each measure actually captures, why a highly diverse marker can make Fst and Gst look low while Jost's D stays high, and how to decide which one your particular research question calls for. The short version, which the rest unpacks, is that these statistics fall into two families measuring complementary things, so the right choice depends on what you want to know. If the base concept is still settling, our explainer on what Fst is lays the groundwork.
The Family Tree
Start with how these measures relate. Fst, defined by Sewall Wright, is the original, built for systems with two alleles. Gst is Masatoshi Nei's 1973 generalization of Fst to handle loci with any number of alleles, and in practice the two names are often used loosely for the same quantity. Both are what the literature calls fixation indices: they measure differentiation as the reduction in heterozygosity caused by population structure.
Then come the challengers. In 2005, Philip Hedrick published a standardized measure, G'st, that rescales Gst by the maximum value it could possibly reach given the heterozygosity of the marker. And in 2008, Lou Jost introduced D, an entirely different statistic built not on heterozygosity but on the effective number of alleles, partitioning genetic diversity into within- and between-population components in a multiplicative way.
So the lineage runs from Wright's Fst to Nei's Gst, with Hedrick's G'st as a correction layered on top of Gst, and Jost's D standing apart as a fundamentally different conception. Understanding that genealogy is the first step, because it explains why Fst and Gst tend to agree with each other while D often does not.
A note on naming will save confusion when you read papers. Strictly, Fst was Wright's two-allele quantity and Gst is Nei's generalization to multiple alleles, but many authors write "Fst" loosely to mean whichever fixation index they computed, including Gst and the Weir and Cockerham estimator θ. When a modern genomics paper reports "Fst," it is almost always a multi-allele, sample-size-corrected estimator in the Gst lineage, not Wright's original formula. The terminology is sloppier than the mathematics, so it is worth checking which estimator a paper actually used rather than trusting the label alone.
Two Families, Two Questions
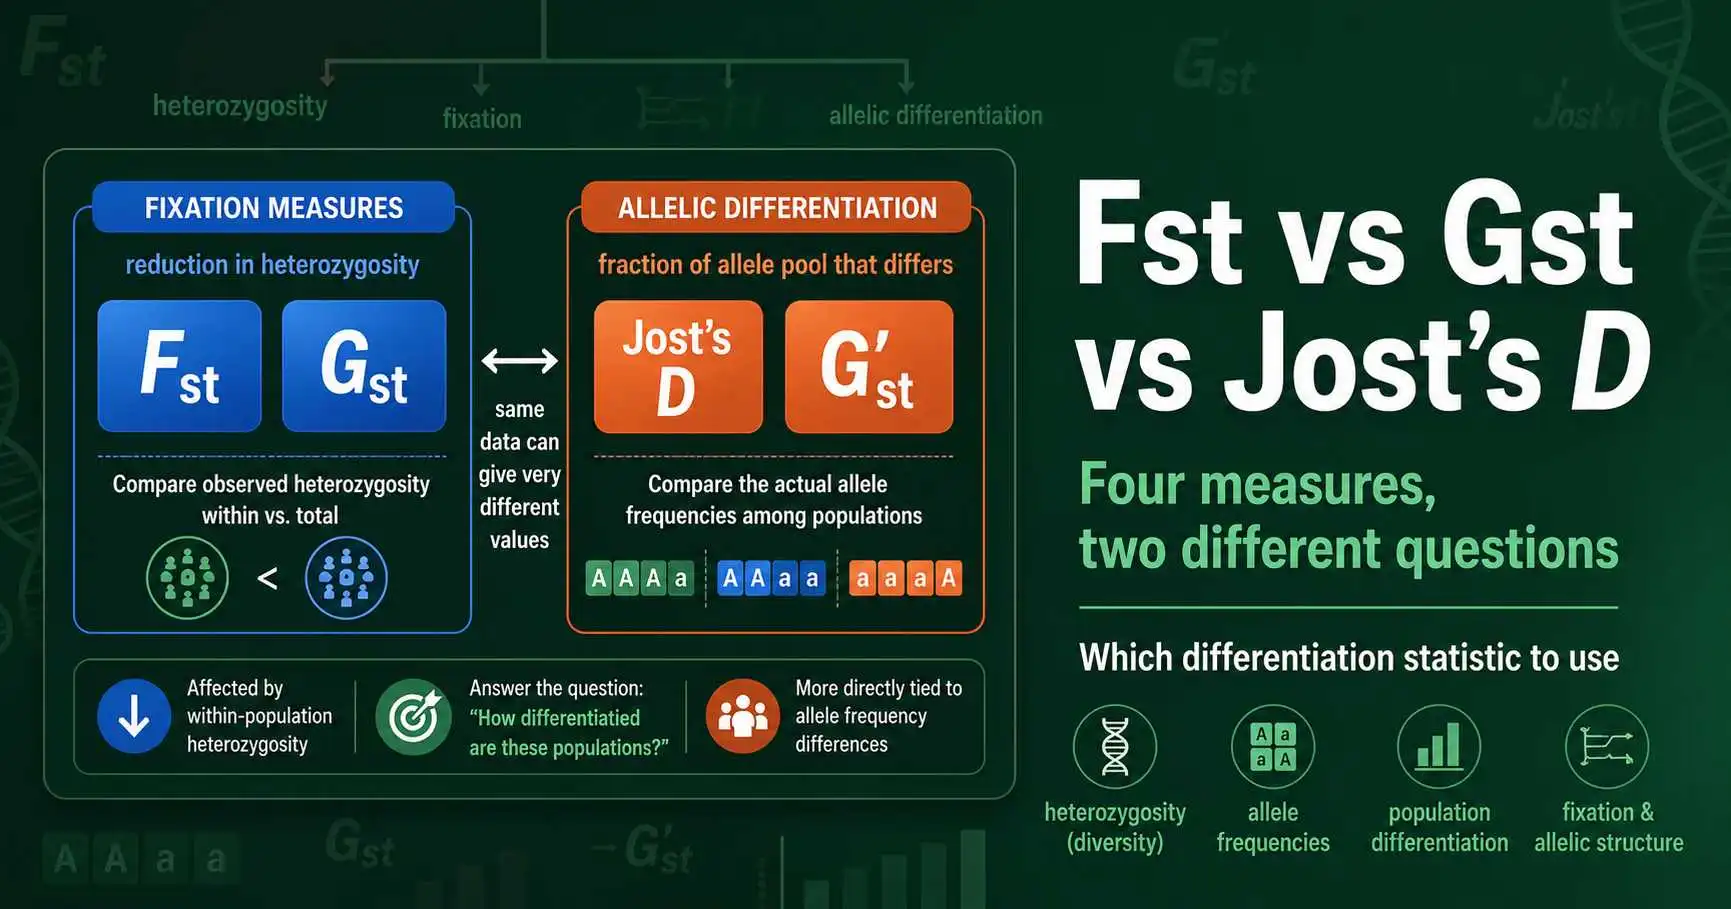
The deepest insight in this whole debate, made explicit by Michael Whitlock in a 2011 paper in Molecular Ecology and later by Lou Jost and colleagues in a 2018 paper in Evolutionary Applications, is that these statistics fall into two distinct families that measure different things.
The first family is the fixation measures: Fst and Gst. They quantify the reduction in heterozygosity due to population structure, equivalently the variance in allele frequencies among populations relative to the total. Ask a fixation measure "how much has structure reduced the diversity within subpopulations compared to the whole," and it answers well. These measures are tightly linked to the processes of drift and migration, which is exactly why Wright's island-model relationship between Fst and migration works.
The second family is the allelic differentiation measures, of which Jost's D is the flagship. These ask a different question: "what fraction of the total allelic variation is found among populations rather than within them," which is closer to the everyday meaning of how different two populations are in their actual alleles. As Whitlock and Jost both stressed, these two families have no necessary relationship with each other. They are not rivals computing the same thing with different accuracy; they are answering genuinely different questions, and confusion arises mostly when people expect one to behave like the other. An analogy helps: asking whether to use Fst or D is a bit like asking whether to measure a journey in hours or in miles. Both are valid, both describe the trip, but they capture different aspects, and converting blindly between them produces nonsense. Fst measures something closer to the evolutionary "time and process" of separation, while D measures the "distance" in allelic terms.
Why They Disagree: The Heterozygosity Problem
The dramatic disagreements between these measures trace to a single property: Fst and Gst depend on how much heterozygosity exists within populations, and that dependence breaks them as measures of allelic differentiation when diversity is high.
Here is the mechanism. The maximum value Gst can reach is not 1; it is bounded above by a quantity that shrinks as within-population heterozygosity rises. With a highly polymorphic marker like a microsatellite, where each population might carry many alleles and heterozygosity approaches 1, the maximum possible Gst can fall to a small number. So two populations that share no alleles at all, completely differentiated in any commonsense reading, can still produce a Gst near zero, simply because the marker is so diverse. Researchers using microsatellites kept finding Gst values that were very low yet statistically significant, and this paradox is what triggered the whole controversy.
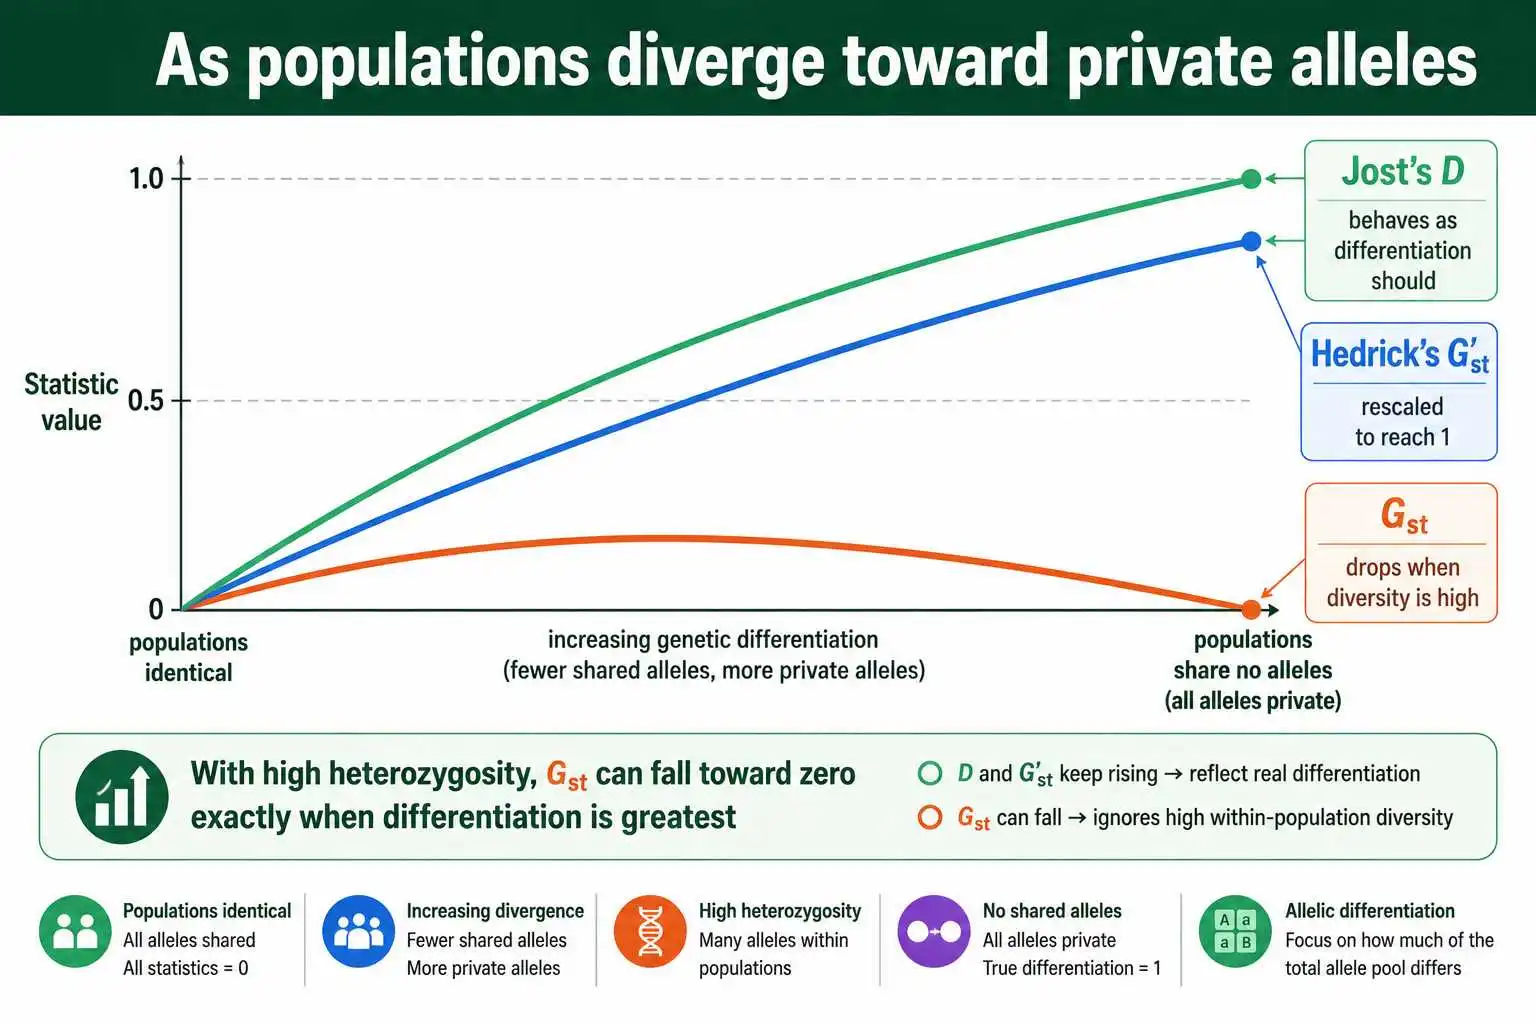
Jost drove the point home with a striking observation, detailed in his 2008 paper and a 2018 follow-up. As a set of populations diverges toward carrying entirely private alleles, the situation of maximum possible differentiation, Gst does the opposite of what a differentiation measure should: it falls toward zero rather than rising toward one. Jost's D, by contrast, rises steadily from near zero toward one across that same process, behaving the way intuition demands. Hedrick's G'st was designed to patch the high-heterozygosity problem by rescaling Gst to its maximum, and it does climb toward one at complete differentiation, but as Jost and others pointed out, the rescaling is an ad hoc fix that introduces its own interpretive difficulties at low heterozygosity.
A Concrete Illustration
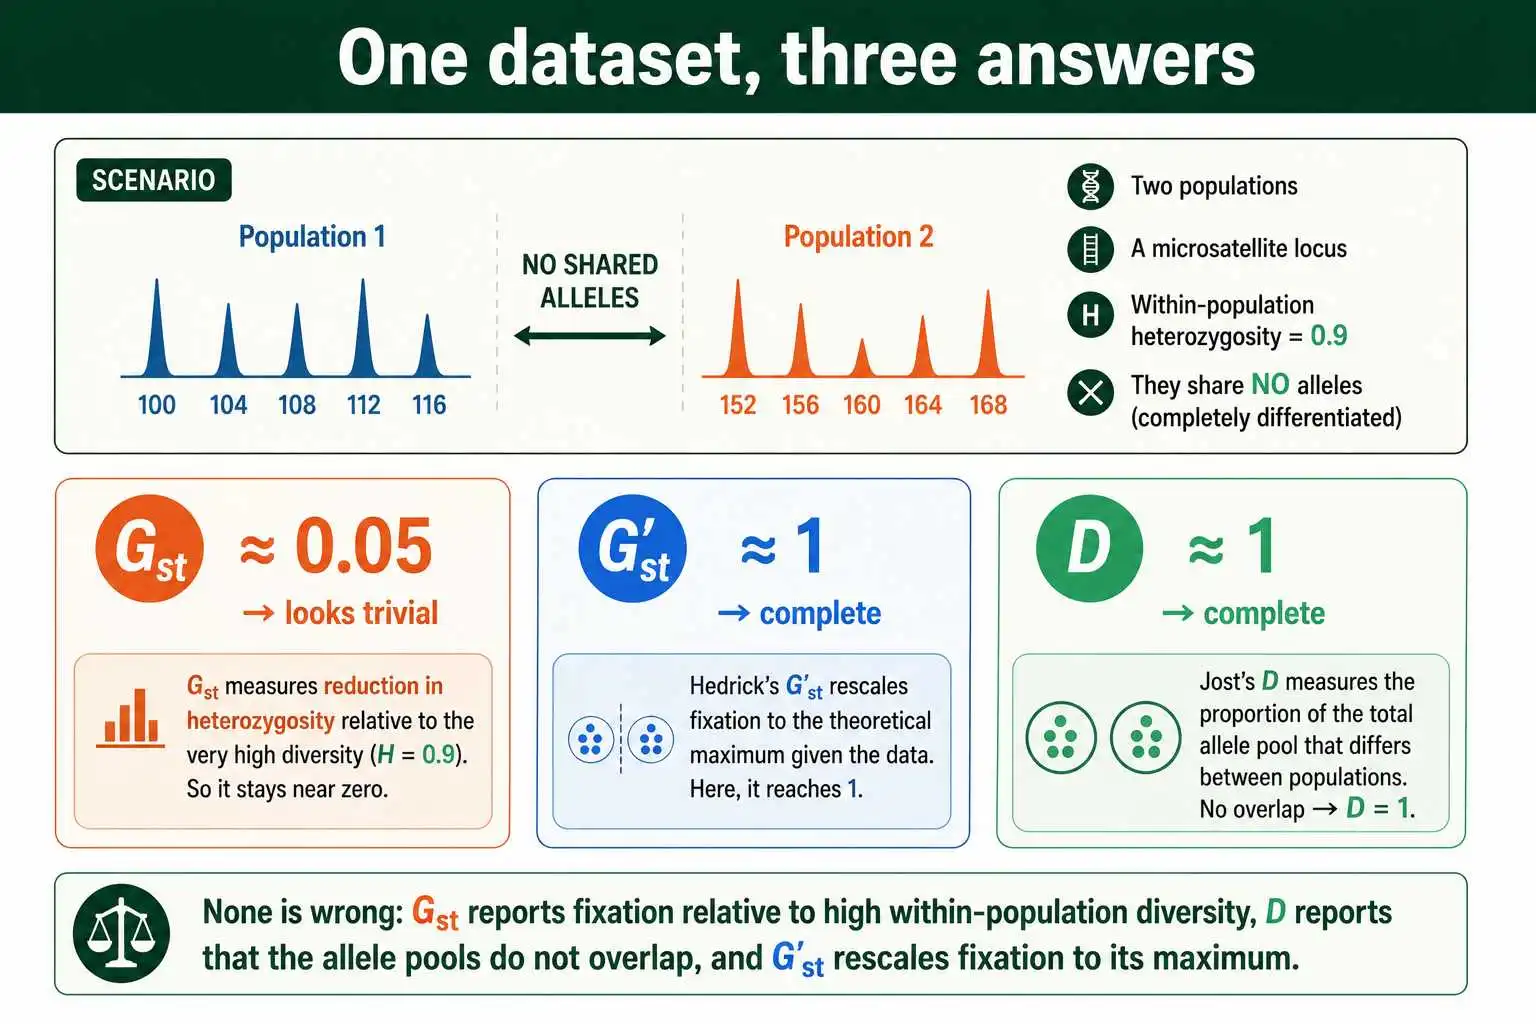
Numbers make the disagreement vivid. Imagine two populations and a microsatellite locus with many alleles, where each population is highly diverse internally, with a within-population heterozygosity of 0.9.
Now suppose the two populations share no alleles whatsoever: every allele in population one is absent from population two, and vice versa. By any plain-language standard, these populations are completely differentiated; they have nothing in common at this locus. Yet because Gst is bounded above by roughly one minus the within-population heterozygosity, its maximum here is only about 0.1. The Gst you would compute could be a small fraction, perhaps 0.05, suggesting trivial differentiation. The number flatly contradicts the biology.
Run Jost's D on the same scenario and it returns a value at or near 1, correctly reporting complete allelic differentiation. Hedrick's G'st, by dividing the observed Gst by that low maximum, also climbs toward 1. So three measures, one dataset, and answers ranging from "barely different" to "completely different." None of the calculations is wrong; they are measuring different properties. Gst is faithfully reporting that within-population diversity is high relative to the modest extra diversity that structure adds, while D is faithfully reporting that the allele pools do not overlap. The lesson is not that Gst lies, but that its answer must be read as the fixation quantity it is, not as a statement about allelic overlap.
How Jost's D Works
Jost's D deserves a closer look, because its logic differs fundamentally from the heterozygosity-based measures and explains why it behaves so differently.
Instead of heterozygosity, D is built on the effective number of alleles, a diversity measure that converts heterozygosity into an equivalent count of equally frequent alleles. Jost partitioned this diversity multiplicatively rather than additively, separating the total diversity into a within-population component and a between-population component. D then expresses the between-population component as a proportion that runs cleanly from 0, when populations are identical, to 1, when they share no alleles. Because it works with the effective number of alleles rather than raw heterozygosity, D sidesteps the ceiling that drags Gst down when diversity is high.
This diversity-partitioning foundation is why Jost argued, in the title of his influential 2008 paper, that Gst and its relatives "do not measure differentiation" in the allelic sense. He was not claiming Gst is meaningless, a point sometimes lost in the heat of the debate, but that it measures fixation, a related yet distinct concept. The critics who pushed back, including Nils Ryman and Olof Leimar, argued that Gst remains a useful and meaningful measure for the demographic questions it was built for. Both sides, in retrospect, were largely right about different things, which is exactly the two-families resolution the field eventually adopted.
Side by Side
The contrasts are easier to hold in a table than in prose. The following summarizes what each measure is, what it captures, and its main limitation.
| Measure | Origin | Measures | Maximum | Main weakness |
|---|---|---|---|---|
| Fst | Wright | Fixation, reduction in heterozygosity | Below 1 with diverse markers | Underreads differentiation when diversity is high |
| Gst | Nei, 1973 | Fixation, multi-allele version of Fst | Below 1 with diverse markers | Same heterozygosity dependence as Fst |
| G'st | Hedrick, 2005 | Gst rescaled to its maximum | Reaches 1 | Ad hoc fix; awkward at low heterozygosity |
| Jost's D | Jost, 2008 | Allelic differentiation, true diversity | Reaches 1 | Not tied to drift and migration like Fst |
The table makes the pattern visible. Fst and Gst share a family and a weakness. G'st and D both reach 1 at complete differentiation, which Fst and Gst cannot with diverse markers, but they get there by different routes and carry different baggage. No row is strictly better than the others, which is the whole reason the debate never resolved into a single winner.
When the Choice Actually Matters
For many real datasets, the practical difference is smaller than the theoretical debate suggests, and knowing when it matters saves a lot of worry.
The choice matters most with highly polymorphic markers. If you are working with microsatellites, which routinely have many alleles and high heterozygosity, Fst and Gst can substantially understate differentiation, and reporting Jost's D or G'st alongside them is wise. The mismatch between a low Gst and a high D in such data is not a contradiction to resolve but two complementary facts to report. The choice matters far less with biallelic markers like most single-nucleotide polymorphisms, where heterozygosity is capped near 0.5 and the measures tend to track each other more closely. This is part of why the modern genomics literature, dominated by SNP data, still leans heavily on Fst.
The choice also matters for what you are asking. If your question is about gene flow, migration, drift, or population structure in the demographic sense, Fst is the right tool, because it is mathematically connected to those processes through Wright's island model and its descendants. If your question is purely about how differentiated the actual allele pools are, regardless of the underlying demography, Jost's D is more faithful to that meaning. Matching the measure to the question, rather than searching for a universally best statistic, is the guidance that emerged from the dust of the controversy.
What the Experts Settled On
After years of argument, the field reached a pragmatic peace rather than a verdict, and a few researchers articulated it clearly. Michael Whitlock's 2011 paper is widely cited as the balanced summary: each measure has its place, and the worst choice is to use one while expecting it to behave like the other.
The consensus runs roughly as follows. Fst and Gst remain appropriate and standard for questions about demographic processes, drift, migration, and the kind of population-structure inference that dominates conservation and evolutionary genetics. Jost's D is the better choice when the goal is to quantify allelic differentiation as such, especially with diverse markers. Many careful papers now report both a fixation measure and D, treating them as complementary descriptions rather than competitors. Simulation studies, including work by Jinliang Wang in 2012 in Genetics Research, reinforced that neither statistic performs best in all situations, which is precisely why a single recommendation was never possible. Other simulation work found that both Gst and D can behave poorly under nonequilibrium conditions, such as recent population expansions or fluctuating sizes, a reminder that every one of these measures rests on assumptions that real populations routinely violate.
There is also a quieter lesson from the episode. The controversy exposed how much the word "differentiation" had been doing without definition, and forcing that word to be precise was itself a contribution. Whether you reach for Fst or D, the discipline now expects you to know which question you are answering, which is a healthier state than the false comfort of one universal number.
Why This Matters for Conservation
The choice of measure is not merely academic; it can change conservation decisions, which is one reason the debate drew such heated attention.
Conservation genetics often uses differentiation measures to decide whether populations are distinct enough to manage as separate units. If a manager relies on Gst from highly polymorphic microsatellite markers and reads a low value as evidence that two populations are essentially one, they might pool them or permit translocation between them, when in fact the populations could be strongly differentiated in their actual allele pools, as Jost's D would reveal. A measure that systematically understates differentiation in diverse markers could, in principle, lead to under-protecting genuinely distinct populations.
This practical stakes argument was part of why Jost framed his critique so forcefully, and why a 2018 treatment by Jost and colleagues focused specifically on differentiation measures for conservation. The prudent course, widely adopted now, is to report multiple measures when the markers are polymorphic and to interpret them in light of what each captures. A conservation unit decision resting on a single statistic from a single marker type is fragile; one informed by both a fixation measure and an allelic differentiation measure is far more robust. The underlying biology that these measures try to capture is how isolated and divergent populations have become, the balance of drift driving them apart and migration holding them together.
Practical Guidance
If you want a workable rule rather than a treatise, a few principles cover most situations.
Use Fst, or its multi-allele form Gst, as your default for SNP data and for any question involving migration, drift, or population structure. It is the standard, it is comparable across the vast existing literature, and with biallelic markers its weaknesses are muted. Pair it with a sample-size-corrected estimator, as the methods literature advises.
Add Jost's D when you work with highly polymorphic markers like microsatellites, or when your explicit goal is to describe how different the allele pools are. If a microsatellite dataset gives a puzzlingly low Gst, computing D will often reveal substantial differentiation that the fixation measure masked. Hedrick's G'st serves a similar purpose and is a reasonable alternative, though D has clearer theoretical footing as a diversity measure.
And whatever you choose, report it explicitly and stay consistent, because comparing a Gst from one study against a D from another is meaningless.
It also helps to know what the common software does, so you can read methods sections critically. The R package mmod computes Gst, Hedrick's G'st, and Jost's D together, which is why many recent papers report all three. The diveRsity and adegenet packages handle these measures as well, and hierfstat focuses on the fixation indices. Because a single function call can now return the whole suite, the friction that once forced researchers to pick one measure has largely vanished. The modern norm in molecular ecology, especially for microsatellite studies, is simply to present the fixation measure and Jost's D side by side and let the reader see both faces of the data. That habit, more than any theoretical resolution, is what defused the controversy in practice.
These cautions echo the broader points about interpretation in our guide on Fst values and what counts as high or low, where the same theme recurs: the number means nothing without its context.
The Bottom Line
Fst, Gst, G'st, and Jost's D are not four attempts at the same measurement. They split into two families: the fixation measures, Fst and Gst, which capture how population structure reduces heterozygosity and connect naturally to drift and migration; and the allelic differentiation measures, led by Jost's D, which capture what fraction of the allele pool actually differs between populations. Hedrick's G'st sits between, a rescaling of Gst meant to fix its behavior at high diversity, useful but theoretically less clean than either of its neighbors.
A final way to hold all this in mind: if someone reports a differentiation value to you, the informative question is rarely "is it high or low" but "which measure is it, and from what marker." A Gst of 0.05 from microsatellites and a D of 0.8 from the same data are not in conflict, and recognizing that is the mark of reading these statistics fluently rather than mechanically.
They disagree most when markers are highly polymorphic, because the fixation measures are mathematically bounded below 1 by heterozygosity while D and G'st are not. The resolution the field reached is not to crown a winner but to match the measure to the question: Fst for demographic and structural questions, D for pure allelic differentiation, and often both, reported side by side. That pluralism is not a failure to decide; it is the correct response to a situation where two reasonable definitions of "differentiation" genuinely diverge. To compute differentiation from your own allele frequencies and see these ideas in action, the Fst population differentiation calculator is the place to start, and the forces that generate any of these values, drift pushing populations apart and gene flow pulling them together, are the subject of our guide on genetic differentiation and gene flow.