Genetic Differentiation and Gene Flow Explained
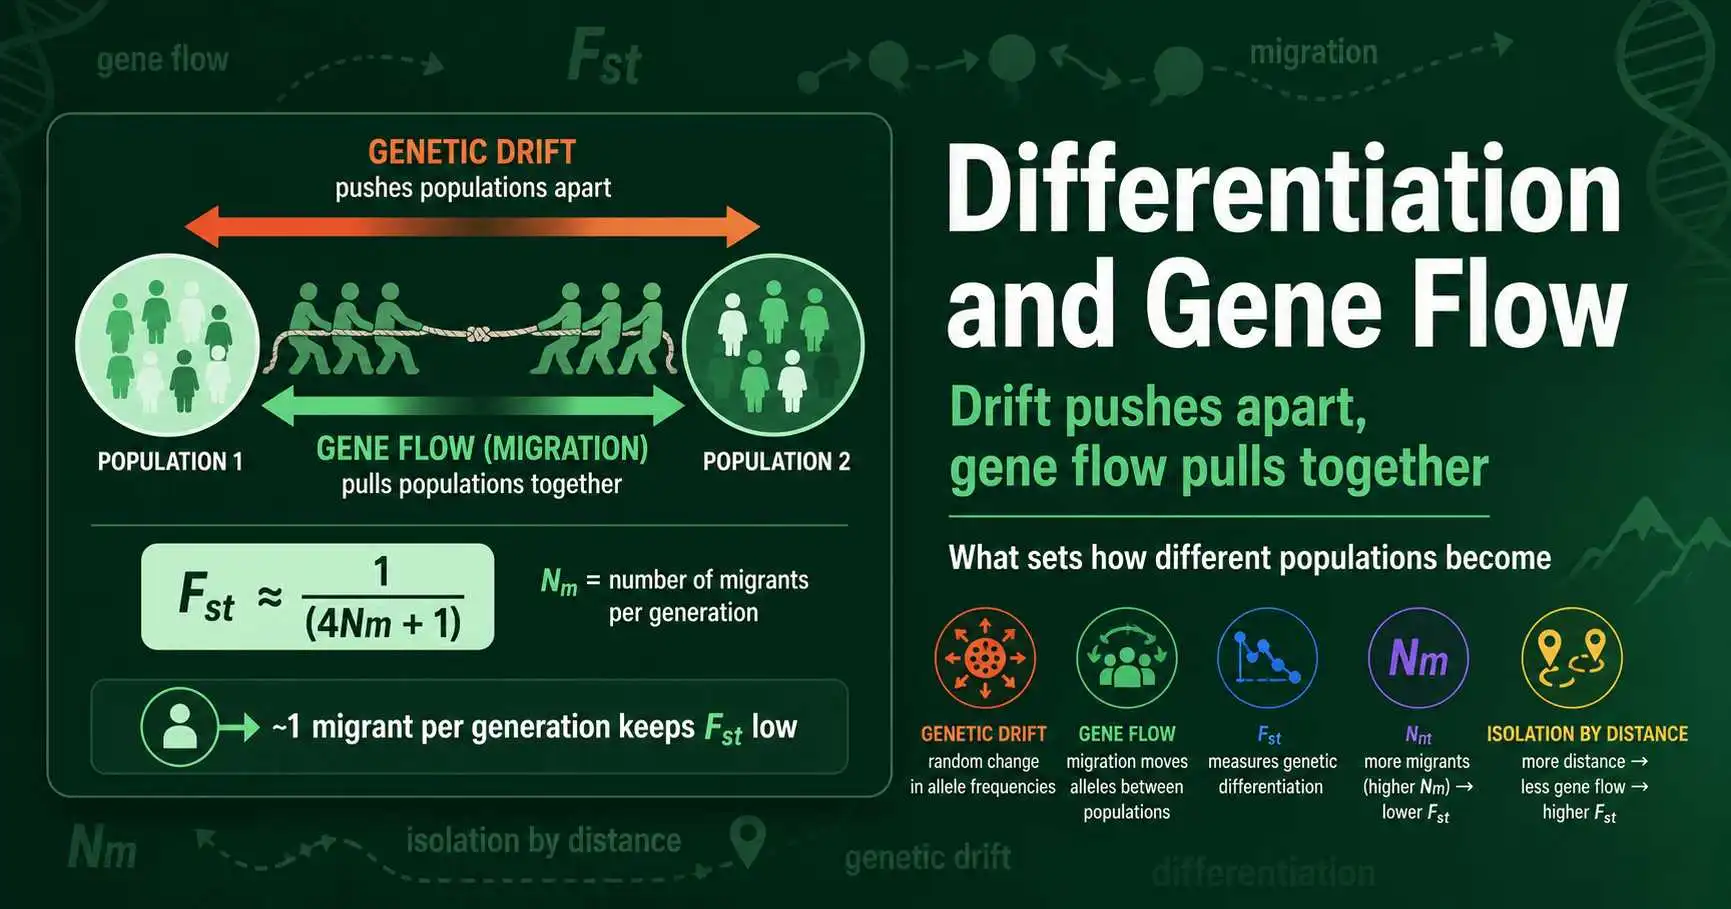
Genetic differentiation is the outcome of a tug of war. On one side, genetic drift pushes populations apart, since isolated groups drift to different allele frequencies by chance over the generations. On the other, gene flow pulls them back together, because migrants carry alleles across population boundaries and blend the gene pools. How differentiated any given set of populations becomes, the quantity that Fst measures, is set by the balance between these two opposing forces.
This guide is about that balance. It covers the elegant relationship Sewall Wright derived between Fst and the number of migrants, the surprising conclusion that very little migration goes a long way, the more realistic pattern of isolation by distance, and what genetic differentiation reveals about a species' biology and history. The forces here are the same ones at the heart of our drift cluster, so if you want the drift side in depth, our explainer on what genetic drift is is the natural companion piece. Here, the focus is on how drift and migration work together to produce the structure we observe.
The Two Opposing Forces
Every pattern of genetic differentiation comes down to two processes working against each other. Understanding them as opposites is the key to everything that follows.
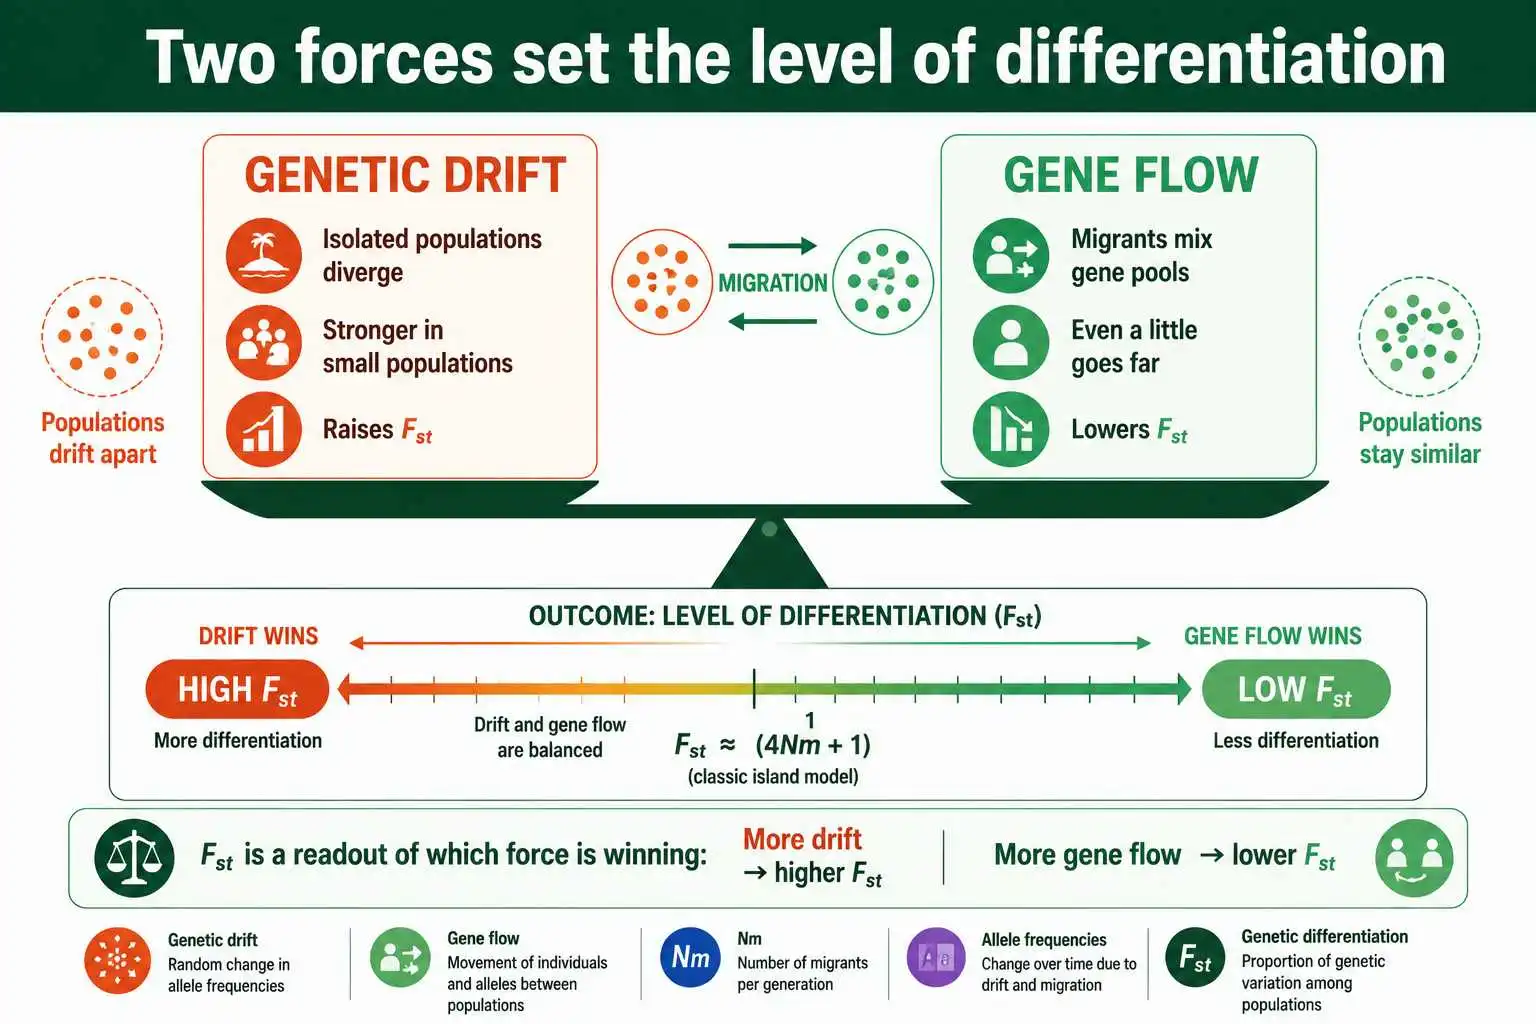
Genetic drift is the differentiating force. In any finite population, allele frequencies wander randomly across generations, and crucially, isolated populations wander independently. Two populations with no contact will drift apart simply because their random changes are uncorrelated, and the smaller the populations, the faster they diverge. Left alone, drift relentlessly increases differentiation, eventually driving isolated populations toward fixation of different alleles.
Gene flow is the homogenizing force. When individuals migrate between populations and reproduce, they carry their alleles with them, injecting the source population's genetic makeup into the recipient. This mixing pulls the populations' allele frequencies toward each other, erasing the differences that drift creates. A high rate of gene flow keeps populations genetically similar no matter how much drift tries to separate them, because the constant exchange of migrants overwhelms the random divergence that drift produces.
So the level of differentiation between populations reflects which force is winning. Where gene flow dominates, populations stay similar and Fst stays low. Where drift dominates, because populations are isolated, small, or both, they diverge and Fst rises. Mutation and selection can modify this picture at particular genes, but for the genome-wide background, the drift-migration balance is the main event. This is why Fst is so informative: it is essentially a readout of that balance, a single number that captures the net result of two opposing evolutionary forces acting over many generations.
Wright's Migration Formula
Sewall Wright captured the drift-migration balance in one of the most cited results in population genetics. Using his island model, in which a set of subpopulations exchanges migrants at a constant rate, he showed that at equilibrium the expected Fst is approximately 1 divided by the quantity 4Nm plus 1.
The term Nm is the key. N is the size of each subpopulation and m is the migration rate, so Nm is the absolute number of migrants exchanged per generation, not the proportion. This distinction is what makes the formula so striking. Because Fst depends on the number of migrants rather than the fraction, the result is largely independent of population size. A population of a million and a population of a thousand reach the same Fst if both receive the same number of migrants per generation.
Working through the numbers reveals the formula's famous lesson. With one migrant per generation, Nm equals 1, and Fst comes to 1 divided by 5, or 0.2, a moderate level of differentiation. With ten migrants, Fst falls to about 0.024, nearly homogeneous. The table below shows the relationship across a range of migration levels.
| Migrants per generation (Nm) | Expected Fst | Interpretation |
|---|---|---|
| 0.25 | 0.50 | Strong differentiation |
| 0.5 | 0.33 | Substantial differentiation |
| 1 | 0.20 | Moderate differentiation |
| 2 | 0.11 | Modest differentiation |
| 5 | 0.048 | Little differentiation |
| 10 | 0.024 | Nearly homogeneous |
| 25 | 0.010 | Effectively one population |
The takeaway, often summarized as the "one migrant per generation" rule, is that even a tiny amount of gene flow prevents substantial differentiation. A single successful migrant each generation holds Fst near 0.2, and a handful keeps it low. This is a genuinely surprising result, because it means populations can be demographically almost independent while remaining genetically connected by the thinnest thread of migration.
The Catch With the Formula
That tidy formula comes with serious caveats, and treating it as a precise migration estimator has led many researchers astray. It is worth being honest about its limits.
The formula assumes Wright's island model, an idealization in which all subpopulations are the same size, exchange migrants at equal rates regardless of distance, and have reached equilibrium between drift and migration. Real populations violate every one of these assumptions. As Michael Whitlock and David McCauley argued in a pointed 1999 paper in the journal Heredity, titled around the inequality that Fst does not simply equal 1/(4Nm+1), the many departures from the island model, population turnover, recent range expansions, fluctuating migration rates, mean that converting an observed Fst into a precise number of migrants is usually unreliable.
The deepest problem is the equilibrium assumption. The formula describes a balance reached after many generations, but many real populations are not at equilibrium. A pair of populations that separated recently has a low Fst not because gene flow is high but because drift has not yet had time to differentiate them. Reading that low Fst as evidence of ongoing migration would be wrong. So the formula is best treated as a conceptual guide to how drift and migration interact, and as a rough order-of-magnitude indicator, rather than a precise gene-flow meter. The qualitative lesson, that a little migration goes a long way, is robust; the quantitative conversion is fragile.
Isolation by Distance
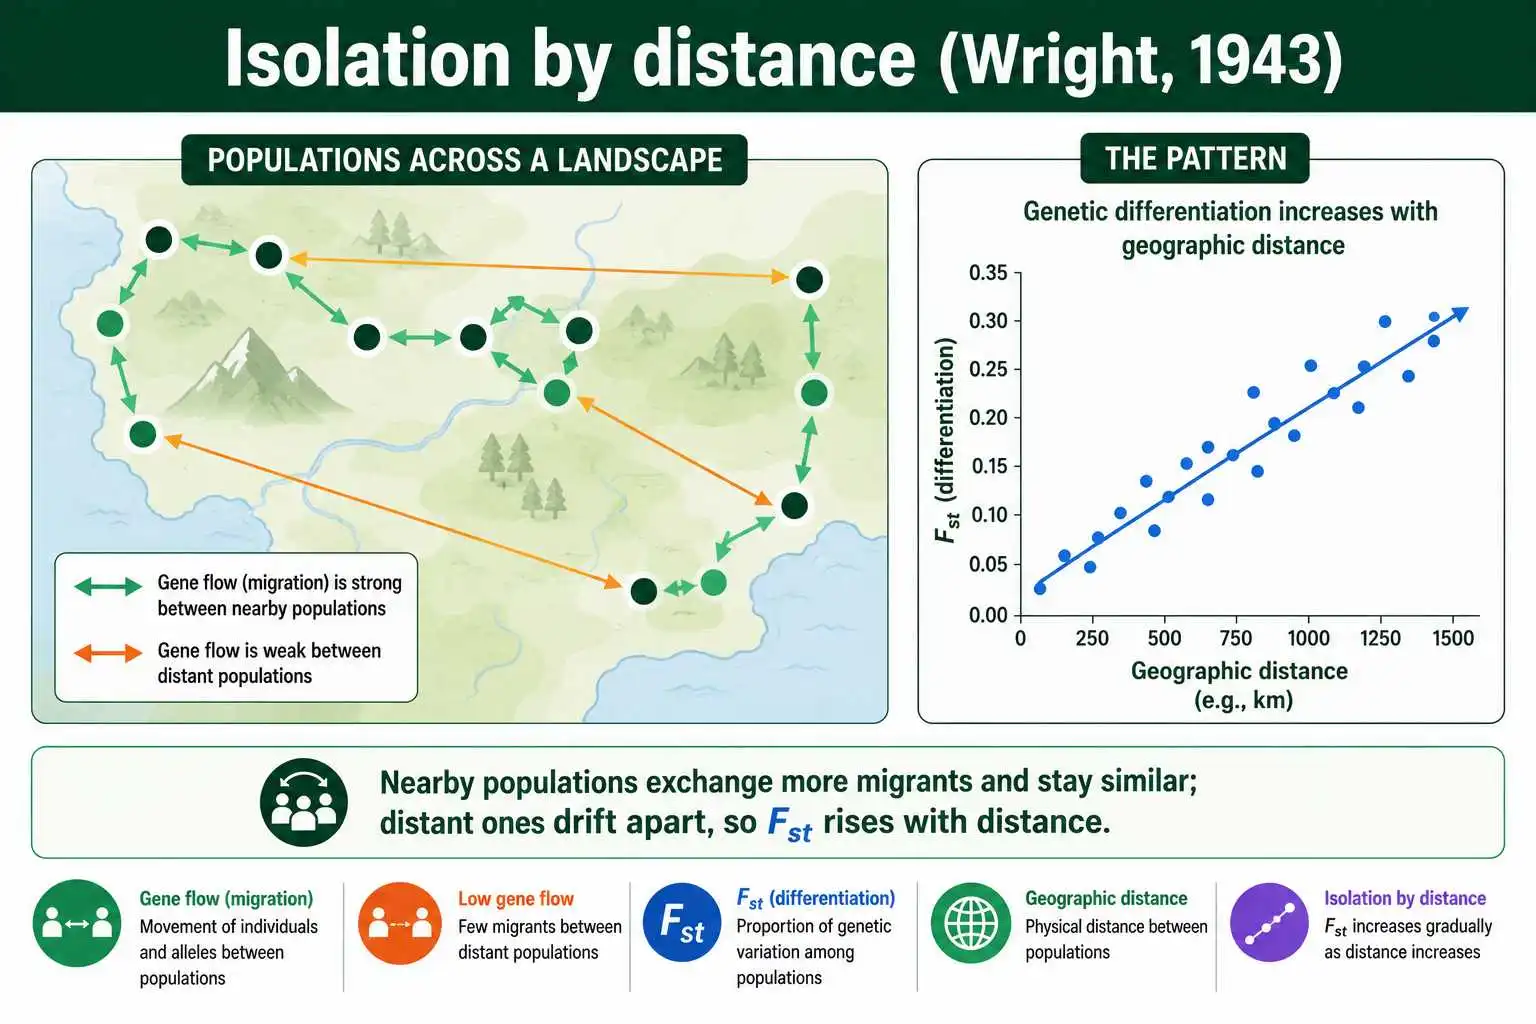
The island model's assumption that migration is equally likely between all populations is its least realistic feature, because in reality nearby populations exchange far more migrants than distant ones. Sewall Wright recognized this and developed a more realistic framework in his 1943 paper, "Isolation by distance".
Isolation by distance describes the pattern that genetic differentiation increases with geographic distance. Because dispersal is usually local, populations close together swap migrants frequently and stay genetically similar, while populations far apart exchange few migrants and drift further apart. The result is a smooth gradient: the farther two populations are from each other, the higher their pairwise Fst tends to be. This is one of the most commonly observed patterns in all of population genetics.
Montgomery Slatkin extended this thinking in influential work in the late 1980s and early 1990s, including a 1993 paper in Evolution showing how the relationship between gene flow and geographic distance can be recovered from genetic data even in non-equilibrium populations. The standard modern test, developed by François Rousset, regresses a transformed Fst, specifically Fst divided by one minus Fst, against the logarithm of geographic distance; a positive slope signals isolation by distance, and the slope itself carries information about dispersal. The related stepping-stone model, formalized by Motoo Kimura and George Weiss in 1964, captures the same idea by allowing migration mainly between adjacent populations along a line or grid. Together these frameworks replaced the unrealistic island model with something that matches how organisms actually move.
What Differentiation Reveals
Because genetic differentiation records the history of drift and migration, an Fst pattern can be read backward to learn about a species' biology, a powerful inferential tool.
High differentiation points to barriers and isolation. When populations show high Fst, something is limiting gene flow between them: a mountain range, a stretch of ocean, a highway, a difference in habitat, or simply great distance. Landscape geneticists exploit this by mapping which geographic features correlate with elevated Fst, identifying the barriers that fragment a species. Low differentiation, conversely, points to connectivity, telling researchers that populations are exchanging migrants and functioning as a connected whole.
The pattern of differentiation also reveals dispersal ability, which is why the species comparisons are so consistent. Highly mobile animals like birds and marine fish, which disperse over great distances, typically show low Fst because their gene flow is high. Sedentary organisms, like many plants, amphibians, and land snails, show high Fst because they disperse little and drift dominates. A species' Fst is, in a real sense, a genetic fingerprint of how far its members move and breed. These patterns connect directly to the conservation questions addressed in our drift cluster's discussion of genetic drift in conservation, where maintaining gene flow between fragmented populations is a central goal.
The discipline of landscape genetics has turned this inference into a systematic method. By overlaying genetic differentiation onto maps of terrain, rivers, roads, and habitat types, researchers test which landscape features act as barriers to gene flow and which act as corridors. A river that coincides with a sharp rise in Fst is implicated as a barrier; a continuous habitat corridor that keeps Fst low is shown to maintain connectivity. This approach has guided real conservation decisions, from siting wildlife crossings over highways to prioritizing habitat corridors that keep populations genetically linked. The logic is always the same: differentiation is the visible trace of gene flow's history, so mapping differentiation maps the invisible movement of genes across a landscape.
Gene Flow in Human History
Humans are a vivid case study in how gene flow shapes differentiation, and the patterns in our own species illustrate the principles cleanly. Human populations show low overall Fst precisely because gene flow has been pervasive throughout our history.
Isolation by distance is strikingly clear in humans. A landmark 2005 study by Sohini Ramachandran, Noah Rosenberg, Marcus Feldman, and colleagues found that genetic differentiation between human populations increases steadily with geographic distance from East Africa, tracing the routes of human migration out of the continent. As each founding group moved farther along the migration path, it carried only a sample of the diversity behind it, so populations farther from Africa are both less diverse and more differentiated from distant populations, exactly the isolation-by-distance signature Wright's theory predicts. Later work, including a 2008 study by John Novembre and colleagues, showed that for European populations the correlation between genes and geography is so tight that a genetic map of individuals reproduces the actual map of Europe with surprising fidelity.
What makes the human pattern instructive is that it combines both forces visibly. Drift during the serial founding of populations along migration routes built up differentiation, while continuous gene flow between neighboring groups kept that differentiation low and gradual rather than producing sharp boundaries. The result is the smooth genetic gradient seen across continents, with no abrupt genetic discontinuities between neighboring peoples. This gradient, low differentiation overall combined with clear isolation by distance, is the genetic signature of a single, recently spread, well-connected species, and it is why human genetic structure is real but shallow.
Reading the Relationship Both Ways
Wright's formula connects Fst and migration, which means it can be read in two directions, and both are useful as long as their limits are respected.
Read forward, from migration to Fst, the formula predicts how differentiated populations should become given a known migration rate. This is how theoreticians explore what levels of connectivity maintain genetic cohesion, and it generates the clean expectation in the table above. Read backward, from Fst to migration, the formula has historically been used to estimate gene flow from genetic data, the so-called indirect method of measuring migration. Because directly observing migration in the field is difficult, especially for small, cryptic, or marine organisms, inferring it from Fst was enormously appealing and dominated molecular ecology for decades.
The backward reading is where the caution from Whitlock and McCauley bites hardest. Converting an observed Fst into a precise migrant number assumes the island model and equilibrium, both usually false, so the resulting Nm estimate can be off by a wide margin. The modern consensus is to use the indirect approach for qualitative or order-of-magnitude inferences, high versus low gene flow, rather than precise migration rates, and to corroborate it with direct methods like mark-recapture or assignment tests where possible. The relationship remains conceptually central even as its use as a precise estimator has faded.
Gene Flow as a Double-Edged Sword
Gene flow is usually framed as beneficial, since it maintains diversity and counteracts the harmful effects of drift and inbreeding in small populations. But its effects are more nuanced, and recognizing both sides sharpens the picture.
On the positive side, gene flow rescues small populations from genetic deterioration. By introducing new alleles, migration raises heterozygosity, masks harmful recessives, and replenishes the variation that drift erodes, which is the logic behind genetic rescue in conservation. A small, isolated population cut off from gene flow is exactly the situation that leads to inbreeding depression and the extinction vortex, so restoring connectivity is often a conservation priority.
On the other side, gene flow can work against local adaptation. When a population is adapting to its specific environment, incoming migrants carrying alleles suited to a different environment can dilute the locally favored alleles, a process sometimes called migration load. Too much gene flow can therefore prevent populations from becoming optimally adapted to local conditions, and in extreme cases swamp a small population's distinct genetic identity entirely. The ideal level of gene flow, from an evolutionary standpoint, is often intermediate: enough to maintain diversity and prevent inbreeding, but not so much as to erase beneficial local adaptation. This tension between homogenization and local adaptation is one of the recurring themes in evolutionary biology.
A concrete example brings the trade-off to life. Consider a population of plants at the edge of a species' range, adapting to harsh marginal conditions. If gene flow from the large central population is heavy, it floods the edge population each generation with alleles adapted to the benign center, swamping the locally favored variants before selection can fix them, and the edge population may never fully adapt. Yet if that same edge population were completely cut off, it would lose diversity to drift and risk inbreeding. The outcome that best serves the population depends on the balance, which is why evolutionary biologists speak of an optimal intermediate level of gene flow rather than treating migration as simply good or bad.
A Note on Equilibrium
One subtlety underlies this entire topic and deserves to be stated plainly, because ignoring it causes real misinterpretation. The neat relationships between Fst, migration, and distance assume the populations have reached equilibrium, a balance struck after many generations of constant conditions.
Equilibrium is an idealization that real populations approach slowly, if at all. After a change, such as a new barrier fragmenting a once-continuous population, or a recent colonization, it takes many generations for Fst to climb to its new equilibrium value. During that long transient, the observed Fst reflects history as much as current gene flow. A recently fragmented population will show lower Fst than its current isolation warrants, because drift has not yet finished its work, while a population that was recently connected might show higher Fst than current barriers would predict.
This is why careful researchers distinguish equilibrium from non-equilibrium interpretations and increasingly use methods, like Slatkin's, designed to work even when equilibrium does not hold. It is also why a single Fst snapshot can mislead about current gene flow. The most reliable inferences combine genetic differentiation with independent information about geography, demography, and history. Read with that care, genetic differentiation remains one of the most powerful windows into how populations connect, diverge, and evolve.
Frequently Asked Questions
How does gene flow affect genetic differentiation?
Gene flow reduces genetic differentiation by mixing alleles between populations. When migrants move and reproduce, they carry alleles across boundaries, pulling populations' allele frequencies toward each other and lowering Fst. It directly opposes genetic drift, which increases differentiation by causing isolated populations to diverge randomly.
What is the one migrant per generation rule?
It is the conclusion from Wright's island model that a single migrant exchanged per generation, regardless of population size, holds Fst near 0.2 and prevents strong differentiation. Because the formula depends on the number of migrants rather than the migration rate, even very little gene flow keeps large populations genetically connected.
What is isolation by distance?
Isolation by distance, described by Wright in 1943, is the pattern where genetic differentiation increases with geographic distance. Because dispersal is usually local, nearby populations exchange more migrants and stay similar, while distant populations exchange few and drift apart, producing a gradient of rising Fst with distance.
The Balance That Builds Structure
Genetic differentiation is the product of two forces in opposition: drift driving isolated populations apart, and gene flow pulling them together. Wright's island model crystallized this in the relationship between Fst and the number of migrants, with its memorable lesson that roughly one migrant per generation is enough to keep populations from differentiating much, almost independent of their size. That formula is a conceptual triumph even though its assumptions make it a shaky precise estimator.
More realistic frameworks, isolation by distance and the stepping-stone model, capture how local dispersal produces a gradient of differentiation across geography, and reading those patterns backward reveals barriers, connectivity, and dispersal ability. Gene flow itself is double-edged, rescuing small populations from drift and inbreeding while potentially diluting local adaptation, and every interpretation must reckon with whether populations have reached equilibrium. To turn allele frequencies into the differentiation values these forces produce, the Fst population differentiation calculator does the computation, and the effective size that governs how fast drift acts in the first place is explained in our guide on effective population size.