Dihybrid Cross: Forked-Line Method vs Punnett Square
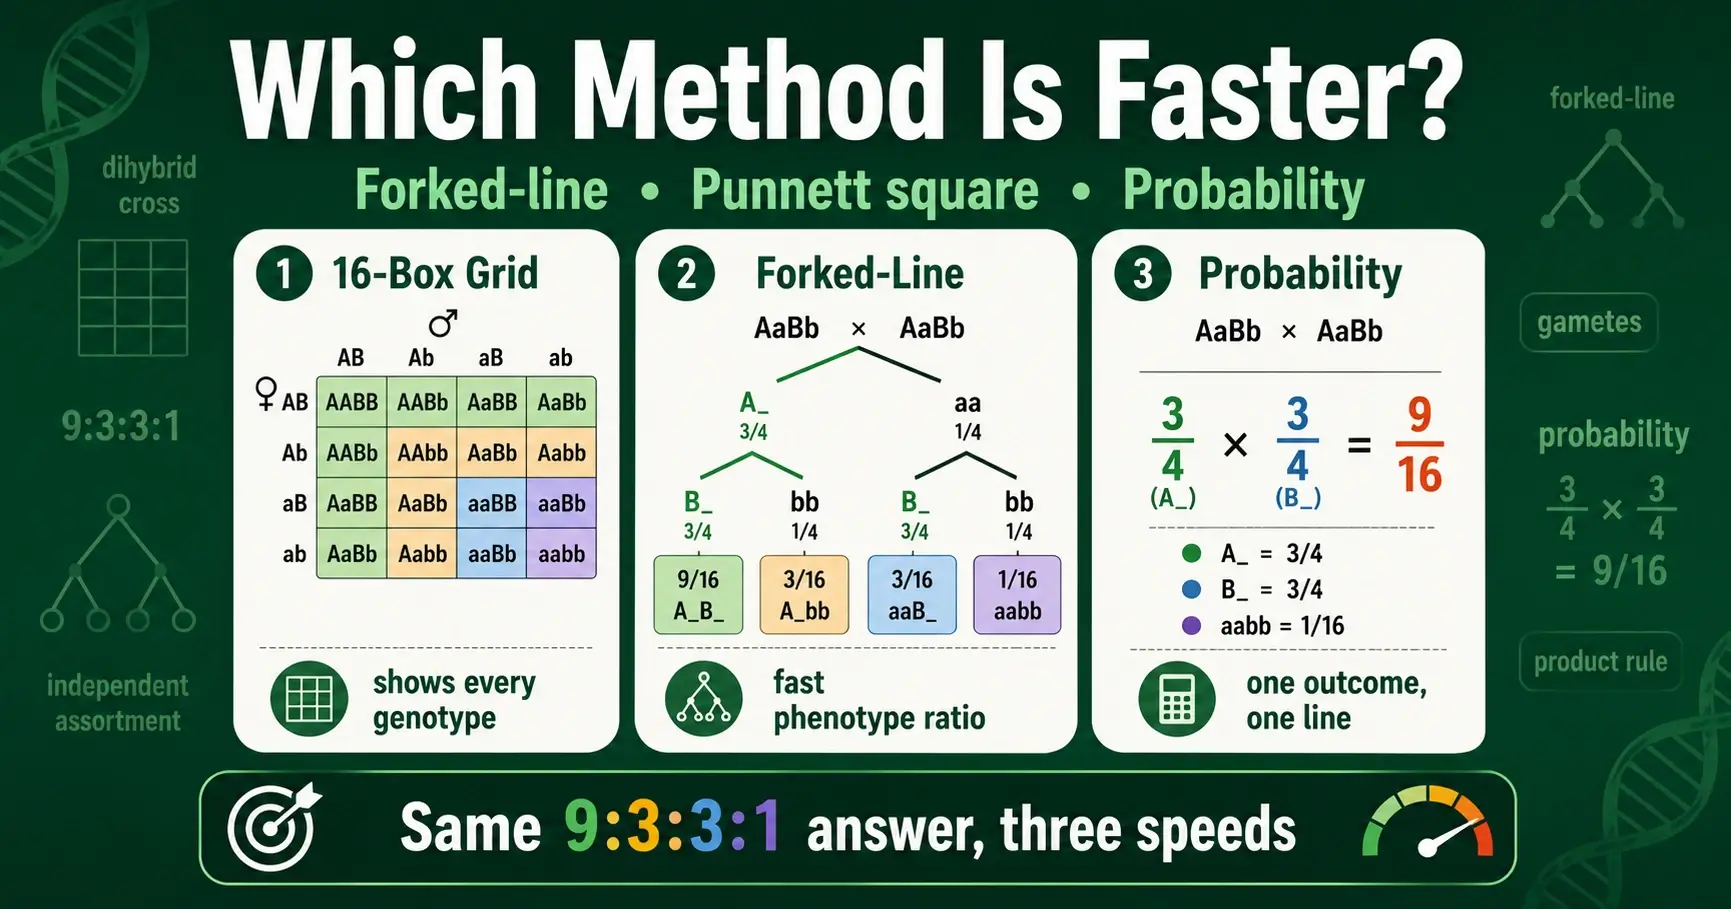
For a dihybrid cross, the fastest method depends on what you need. The 16-box Punnett square is best when you want to see every genotype laid out. The forked-line method is faster when you only need the phenotype ratio. The probability method is fastest of all when you want the odds of one specific outcome. All three give the same 9:3:3:1 result, so the smart move is matching the method to the question.
Most students learn only the grid, then get bogged down filling sixteen boxes by hand and making errors along the way. That is the slow road. This guide compares the three methods head to head, shows you how each one solves the same cross, and gives you a simple rule for picking the right tool every time. If you need a refresher on the cross itself first, the full walkthrough of the dihybrid cross and the 9:3:3:1 ratio covers the basics. Here, the focus is purely on speed and method choice.
The Three Ways to Solve a Dihybrid Cross
Every dihybrid cross can be solved three ways, and each suits a different goal. Knowing all three turns a tedious chore into a quick decision, because you stop forcing every problem through the same grid.
The first method is the Punnett square, the familiar grid. For two traits it is a 4x4 box with sixteen cells, each holding one possible offspring genotype. It is visual and complete, showing every genotype and how often it appears. The second method is the forked-line method, also called the branch or tree method. It treats the cross as separate single-trait crosses and branches them together, skipping the grid entirely. The third method is the probability method, which uses simple multiplication to find the chance of any specific combination without drawing anything.
The thing to understand up front is that these are not competing answers but different routes to the same destination. They all rest on the same genetics: each trait assorts independently, so each behaves like its own monohybrid cross. That shared foundation is why the forked-line and probability methods work at all, and why they always agree with the grid. The difference is purely in effort, and the right choice depends on the question you are actually being asked.
Method 1: The 16-Box Punnett Square
The Punnett square is the method most people learn first, and it has a real strength: it shows everything. For a dihybrid cross you build a 4x4 grid, because each parent makes four kinds of gamete. Filling all sixteen boxes gives you every possible offspring genotype in one picture.
To use it, you first work out the four gametes each parent produces. A double-heterozygote like RrYy makes RY, Ry, rY, and ry, found most reliably with the FOIL method. You write one parent's four gametes across the top and the other's down the side, then combine them box by box. The completed grid contains all sixteen offspring genotypes, which you then sort by phenotype to read the 9:3:3:1 ratio.
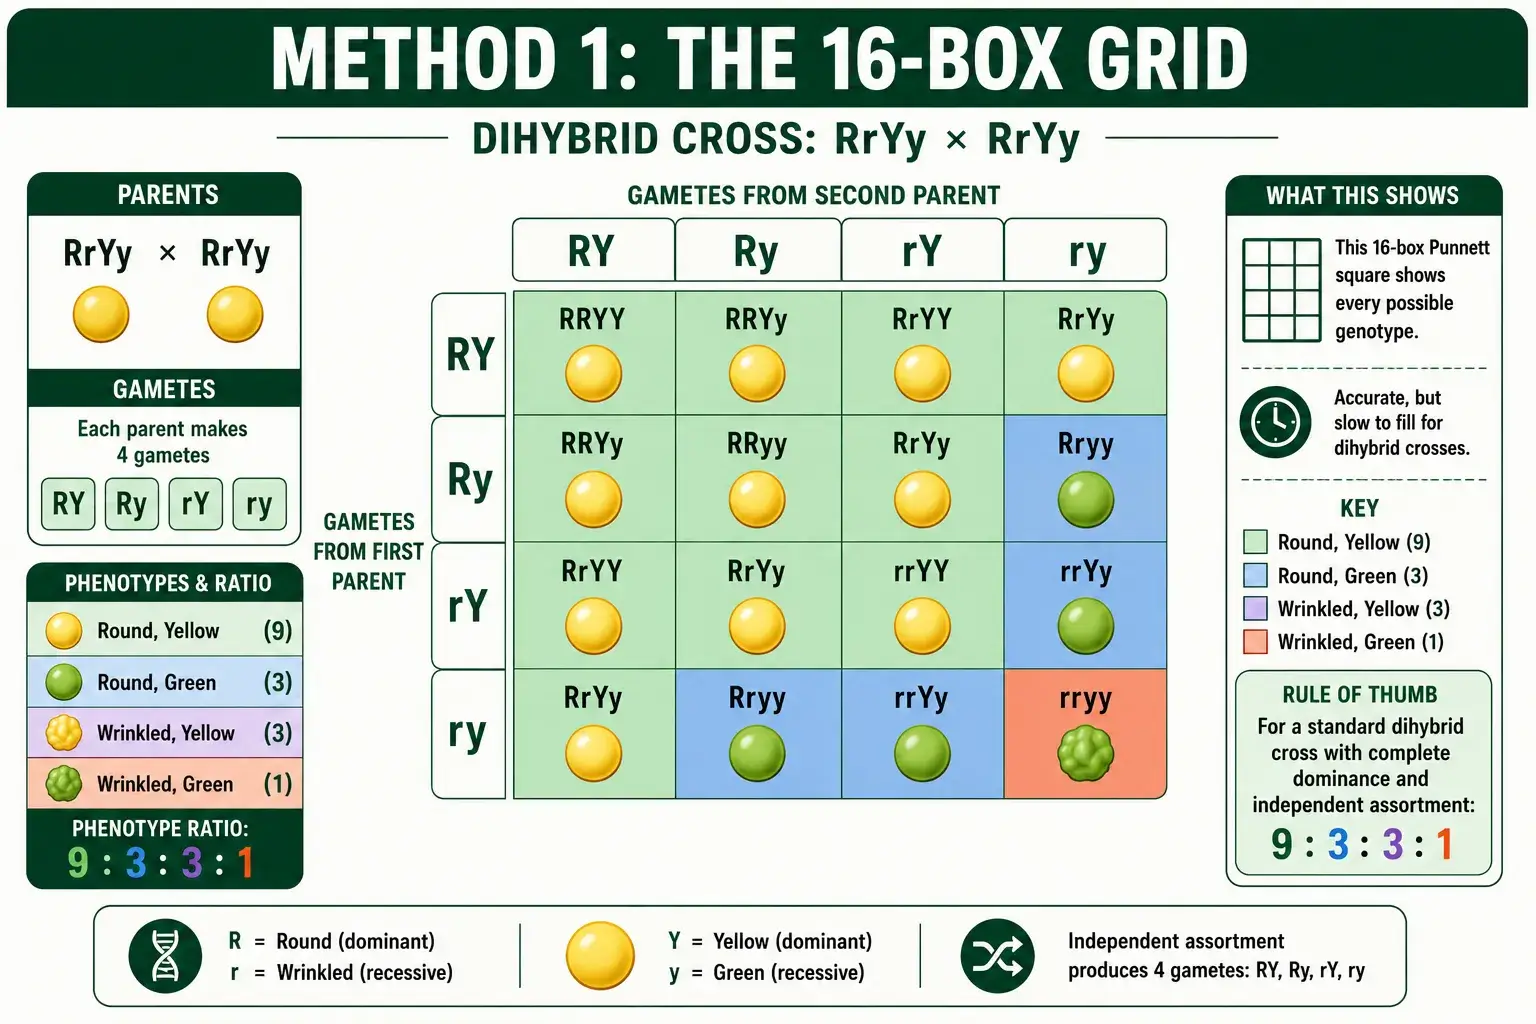
The grid shines when you need the genotype detail. If a question asks how many offspring are expected to be the double-heterozygote RrYy, or wants the full genotype ratio, the grid lays it out visually so you can count. The drawback is speed and error rate. Filling sixteen boxes by hand is slow, and a single mistake in the gametes or one mislabeled box throws off the whole result. For two traits it is manageable. As you will see, it stops being practical the moment you add a third.
Method 2: The Forked-Line Method
The forked-line method skips the grid and treats the dihybrid cross as two separate monohybrid crosses joined by branches. It is usually faster than the grid for finding a phenotype ratio, because you never write out sixteen boxes. Instead, you build a small branching tree.
Here is how it works for a RrYy by RrYy cross. Start with the first trait, seed shape. On its own, Rr by Rr gives a 3:1 ratio, so you draw a fork splitting into 3 round and 1 wrinkled. Then, from each of those two branches, draw a second fork for seed color, which also gives 3 yellow and 1 green. You now have four paths from start to tip. Multiply along each path: the round branch (3) splits into round yellow (3 times 3 equals 9) and round green (3 times 1 equals 3), while the wrinkled branch (1) splits into wrinkled yellow (3) and wrinkled green (1). The four tips read 9, 3, 3, and 1.
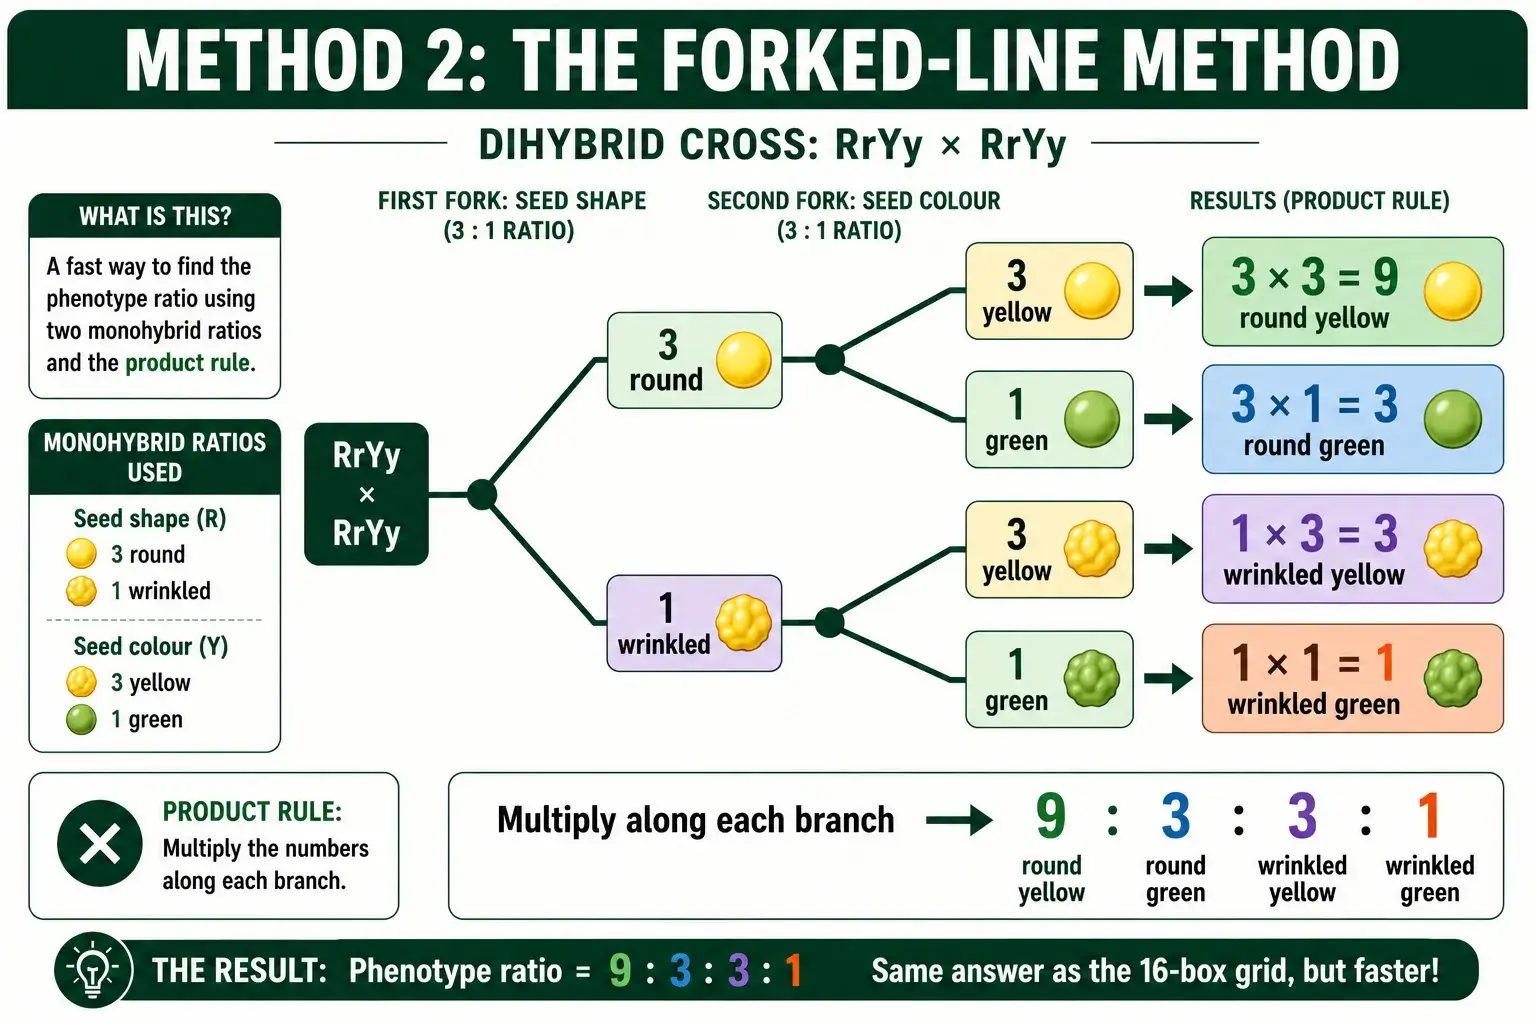
The beauty of this method is that it scales. Adding a third trait means adding one more fork at the end of each branch, not jumping to a 64-box grid. That makes it the go-to method for crosses with several traits, where a grid becomes hopeless. Its limit is that the branches themselves multiply as traits pile up, so for four or five traits even the tree gets crowded. Still, for a dihybrid or trihybrid cross where you want the full phenotype breakdown, the forked-line method is reliably quicker than drawing boxes. A forked-line method calculator builds these branch diagrams automatically and handles the multiplication for you.
Method 3: The Probability Method
The probability method is the fastest of the three when you want the odds of one particular outcome. It uses nothing but multiplication, based on a single rule: because traits assort independently, you find the chance of a combination by multiplying the chances of each separate trait.
The rule at work is the product rule of probability, which says the chance of two independent events both happening is the product of their individual chances. For genetics, that means you treat each trait as its own monohybrid cross, find the probability for that trait alone, then multiply across traits. In a RrYy by RrYy cross, the chance of round is 3/4 and the chance of yellow is 3/4, so the chance of a round yellow offspring is 3/4 times 3/4, which equals 9/16. The chance of a wrinkled green offspring is 1/4 times 1/4, or 1/16.
This method wins when a question targets a single combination rather than the whole ratio. If you are asked only for the fraction of offspring that are wrinkled and green, you do not need a grid or a full tree. You multiply 1/4 by 1/4 and you are done in seconds. The probability method also underpins how genetics tools compute results internally, and it is the only sane approach for four or more traits, where you simply multiply more fractions together. Its one weakness is that it gives you a number, not a picture, so it is less useful when you need to see every genotype at once. The same multiplication is what any genetics tool uses to return the odds of a combination you specify.
Head-to-Head: Speed and Best Use
Lined up side by side, the three methods sort cleanly by what each does best. None is universally fastest; each wins for a particular type of question.
| Method | Best for | Speed for 2 traits | Scales to more traits? |
|---|---|---|---|
| Punnett square (grid) | Seeing every genotype | Slow, 16 boxes | Poorly |
| Forked-line method | Full phenotype ratio | Fast | Yes, with effort |
| Probability method | One specific outcome | Fastest | Yes, easily |
The pattern is clear. If you need the complete genotype picture, the grid is worth its extra effort because it shows everything in one view. If you need the full phenotype ratio, the forked-line method gets you there faster without sacrificing the breakdown. If you need the odds of just one combination, the probability method beats both with a single multiplication.
A practical habit follows from this. Read the question before choosing a method. "What is the genotype ratio" points to the grid. "What is the phenotype ratio" points to the forked-line method. "What is the chance of a specific offspring" points to probability. Matching the tool to the question is the real shortcut, and it is what separates students who finish quickly from those who grind through sixteen boxes every time.
Why All Three Give the Same Answer
It can seem suspicious that three different methods always land on 9:3:3:1, but the reason is solid and worth understanding. All three rest on the same principle: Mendel's law of independent assortment.
Independent assortment means the two genes sort into gametes without influencing each other. The shape gene does not care what the color gene does. Because of that independence, each trait behaves exactly like its own monohybrid cross, giving a clean 3:1 ratio on its own. The grid captures this by listing every combination of the independent gametes. The forked-line method captures it by branching each independent trait separately. The probability method captures it by multiplying the independent chances. Same principle, three representations.
This is also why the methods stop agreeing if the genes are linked. When two genes sit close together on the same chromosome, they do not assort independently, so they travel together more often than chance predicts. The neat 9:3:3:1 ratio breaks down, and the shortcuts that assume independence no longer apply. So the agreement among the three methods is not a coincidence; it is a direct consequence of the genes being unlinked. As the Biology LibreTexts treatment notes, the forked-line and probability methods produce proportions identical to the Punnett square precisely because they share this foundation.
When the Grid Becomes Impractical
The case for learning the shortcuts becomes overwhelming the moment you go past two traits, because the Punnett square grows explosively. The grid size follows the gametes, and the gametes double with each added trait.
The numbers tell the story. One trait needs a 2x2 grid with 4 boxes. Two traits need a 4x4 grid with 16 boxes. Three traits jump to an 8x8 grid with 64 boxes. Four traits reach a 16x16 grid with 256 boxes, and five traits would demand a 32x32 grid with over a thousand cells. Drawing and filling a 256-box grid by hand is not a study technique; it is a punishment.
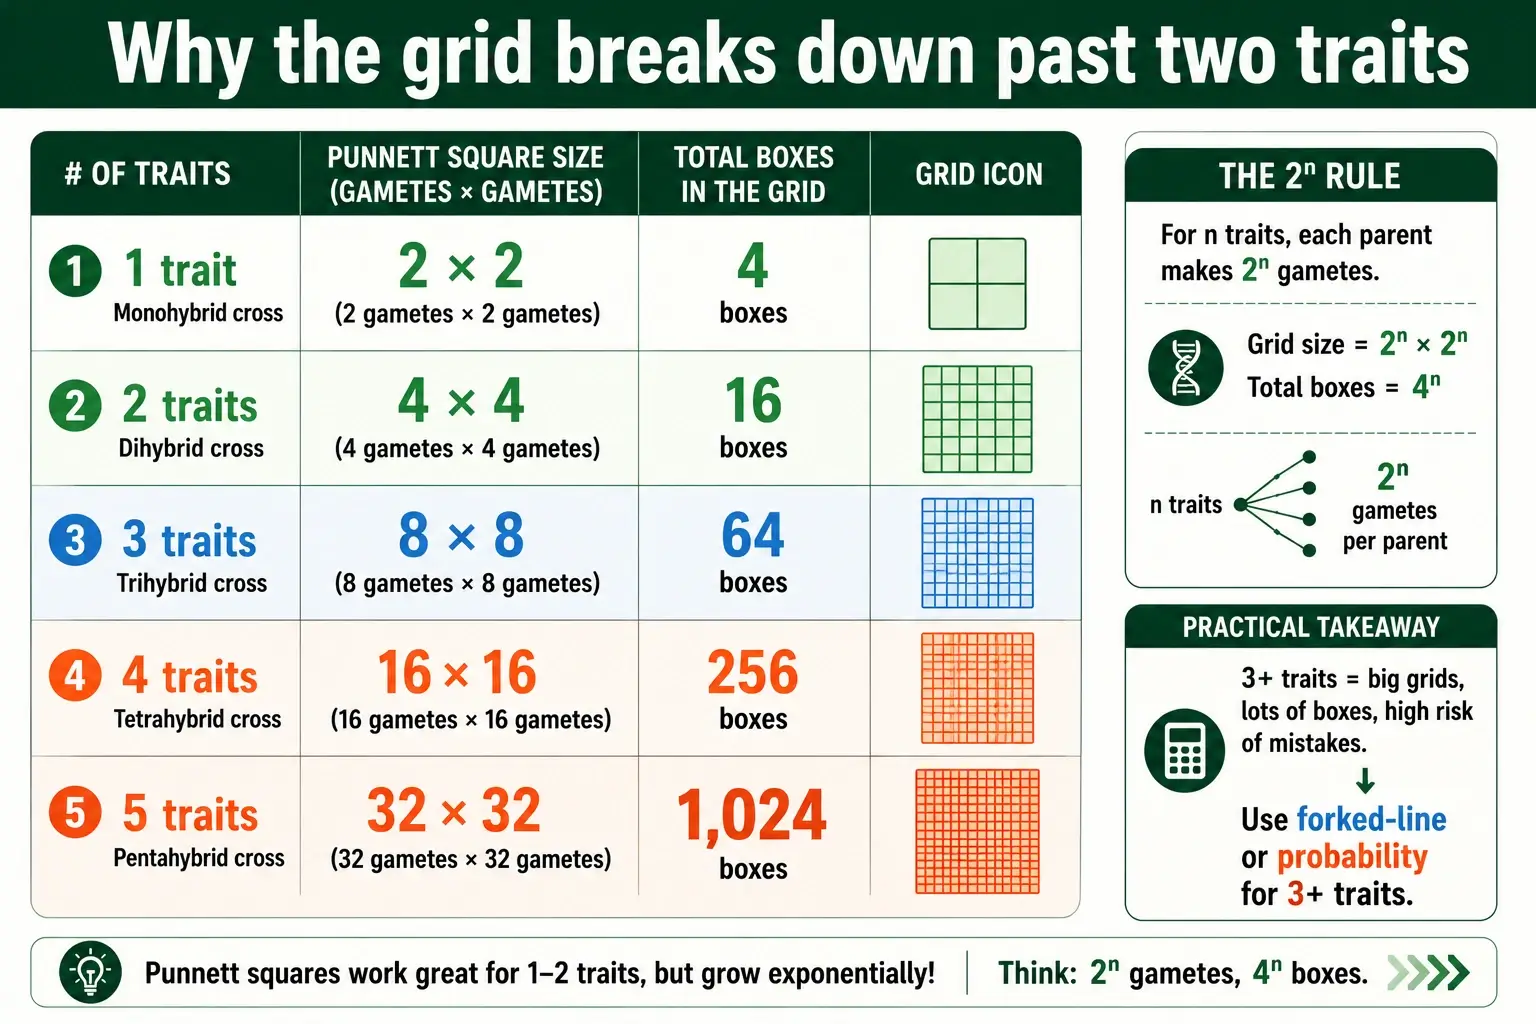
This is exactly where the forked-line and probability methods prove their worth. A four-trait cross that would need 256 boxes is solved with probability in a single line: the chance of being homozygous recessive for all four traits is 1/4 multiplied by itself four times, which is 1/256. No grid required. The forked-line method handles the same cross with four forks instead of an impossible square. The lesson is that the grid is a fine training tool for one or two traits, but the shortcuts are what make multi-trait genetics actually doable. For crosses with three or more traits, a dedicated trihybrid cross calculator removes the manual work entirely.
A Worked Comparison: Solving One Cross Three Ways
To see the methods in action, take a single question and answer it three ways: in a RrYy by RrYy cross, what fraction of offspring will be round and yellow?
With the grid, you would fill all sixteen boxes, then count the ones showing both dominant traits. Nine of the sixteen boxes are round and yellow, giving 9/16. Accurate, but you drew sixteen boxes to get there. With the forked-line method, you build the tree and follow the path for round (3) and yellow (3), multiplying to reach the round-yellow tip at 9, out of a total of sixteen, again 9/16. Faster, and you also got the other three phenotype classes for free along the way.
With the probability method, you skip straight to the answer. The chance of round is 3/4, the chance of yellow is 3/4, and multiplying gives 3/4 times 3/4 equals 9/16. One line, no drawing. For this specific question, probability is the clear winner. But notice the tradeoff: the probability method gave you only the round-yellow fraction, while the grid and the forked-line method also handed you the full breakdown of all four phenotypes. That tradeoff, speed for a single answer versus completeness for the whole picture, is the entire decision in miniature.
Common Mistakes When Choosing a Method
Picking the wrong method wastes time, and a few habits trip students up again and again. Spotting them is part of working efficiently.
The most common mistake is defaulting to the grid for everything. Many students draw a 16-box square even when the question only asks for the chance of one phenotype, which a single multiplication would answer instantly. Reading the question first prevents this. A second mistake is misusing the forked-line method by forgetting to multiply along the branches. The branches show the combinations, but the numbers at the tips only come out right when you multiply the values along each path, not add them. Skipping that multiplication gives wrong ratios.
A third error is applying any shortcut to linked genes. The forked-line and probability methods both assume independent assortment, so they only work when the genes are unlinked. Using them on linked genes produces a confident but wrong answer, because the genes do not sort freely. A fourth slip is botching the gametes before the method even starts. Whether you use a grid or a tree, a RrYy parent makes four gametes, and getting those wrong corrupts every method downstream. Sorting the gametes carefully is the foundation that all three approaches share, so it deserves the most care.
How to Memorize the 9:3:3:1 Ratio
Because the dihybrid phenotype ratio is so common, it pays to lock it into memory rather than deriving it every time. A few mental anchors make it stick.
The simplest anchor is the math behind it. The ratio is just two 3:1 monohybrid ratios multiplied together, since each trait gives 3 dominant to 1 recessive. Multiply 3 and 1 by 3 and 1 and you get 9, 3, 3, and 1, the four products. Once you see the ratio as a product of two simple crosses rather than a random string of numbers, it becomes easy to reconstruct on the spot. The 9 is both-dominant, the two 3s are the mixed combinations, and the 1 is both-recessive.
A second anchor is the total. The four parts add up to 16, which matches the 16 boxes of the grid and the denominator in every fraction (9/16, 3/16, 3/16, 1/16). If your ratio parts do not sum to 16, you know something went wrong. Keeping both anchors in mind, that the ratio is two 3:1 crosses multiplied and that the parts total 16, lets you produce 9:3:3:1 instantly and check it for errors, which speeds up every method you choose.
Which Method to Use in Exams
In a timed exam, method choice is a strategy, not just a preference, because the clock rewards the fastest correct route. The trap many students fall into is drawing a full grid out of habit and running out of time on later questions.
The efficient approach is to scan what each question actually demands. If it asks for a specific genotype count or the full genotype ratio, the grid is the safest choice despite being slower, because it shows the detail you need to count. If it asks for the phenotype ratio, the forked-line method gets you there faster and still gives the full breakdown. If it asks for the probability of one outcome, multiply and move on. Many exam questions are phrased to reward the probability method, asking things like "what is the chance an offspring is wrinkled and green," which is a one-line answer rather than a sixteen-box exercise.
There is also a hybrid tactic worth knowing. You can solve each trait as a quick monohybrid cross, then combine only the parts you need. For a question about one phenotype, find that trait's probability and multiply, ignoring the rest. This selective approach is often faster than any complete method, because you never compute outcomes the question does not ask about. Practising all three methods until you can switch between them fluidly is the single best way to save time, since the right tool can turn a multi-minute grid into a ten-second multiplication.
Frequently Asked Questions
Is the forked-line method faster than a Punnett square?
Usually yes, for finding a phenotype ratio. The forked-line method skips drawing sixteen boxes and branches the traits instead, which is quicker and less error-prone. The Punnett square is only better when you need to see every individual genotype.
Which method is best for three or more traits?
The probability or forked-line method. A Punnett square for three traits needs 64 boxes and for four traits needs 256, which is impractical by hand. Multiplying probabilities or branching forks handles many traits with far less effort.
Do the three methods always give the same answer?
Yes, as long as the genes assort independently. All three rest on Mendel's law of independent assortment, so they produce the same 9:3:3:1 ratio. They only disagree when genes are linked and no longer sort independently.
Bringing It Together
There is no single fastest way to solve a dihybrid cross, only the right method for the question. The 16-box Punnett square shows every genotype but is slow to fill. The forked-line method branches the traits and quickly delivers the full phenotype ratio. The probability method multiplies the odds and answers a single-outcome question in one line. All three agree on 9:3:3:1 because they share the same foundation of independent assortment.
The real skill is reading the question and reaching for the method that fits, then leaning on the shortcuts as soon as a third trait appears. You can check your work on any cross, by any method, with the Punnett Square Calculator, which handles the grid, the ratios, and the probabilities so you can focus on understanding rather than bookkeeping. For more on how these methods scale to complex crosses, this resource is a useful reference to read here.