round, yellow
56.3%
9/16 or 9/16
Calculate exact offspring probabilities for two-gene crosses such as AaBb × AaBb, AaBb × aabb, and AaBb × Aabb. The tool builds gametes, displays a live Punnett grid, and reports genotype and phenotype probabilities for specific trait combinations.
Enter both parent genotypes and choose the phenotype you want to solve. Results update on every input change.
Start with a common cross, then edit the parent genotypes or phenotype target.
Use four alleles in AABB order, such as AaBb, Aabb, aaBb, or aabb.
Gametes from Parent 1
The first two letters represent locus A. The last two letters represent locus B.
Gametes from Parent 2
Rename the trait classes to match your organism or textbook problem.
Choose the phenotype combination you want to calculate.
Live probability result
In the cross AaBb × AaBb, the selected phenotype has a probability of 9/16 per offspring.
Target probability
56.3%
9/16
56.3%
9/16 or 9/16
18.8%
3/16 or 3/16
18.8%
3/16 or 3/16
6.3%
1/16 or 1/16
Each cell combines one gamete from each parent. Cell probability reflects the gamete probabilities, so homozygous parents create smaller grids.
aabb
wrinkled, green
6.3%
aaBb
wrinkled, yellow
6.3%
Aabb
round, green
6.3%
AaBb
round, yellow
6.3%
aaBb
wrinkled, yellow
6.3%
aaBB
wrinkled, yellow
6.3%
AaBb
round, yellow
6.3%
AaBB
round, yellow
6.3%
Aabb
round, green
6.3%
AaBb
round, yellow
6.3%
AAbb
round, green
6.3%
AABb
round, yellow
6.3%
AaBb
round, yellow
6.3%
AaBB
round, yellow
6.3%
AABb
round, yellow
6.3%
AABB
round, yellow
6.3%
Genotype classes collapse identical outcomes from the Punnett grid.
The ratio below uses sixteenths so it matches the standard dihybrid grid when both parents are heterozygous.
9:3:3:1
Most likely phenotype: round, yellow
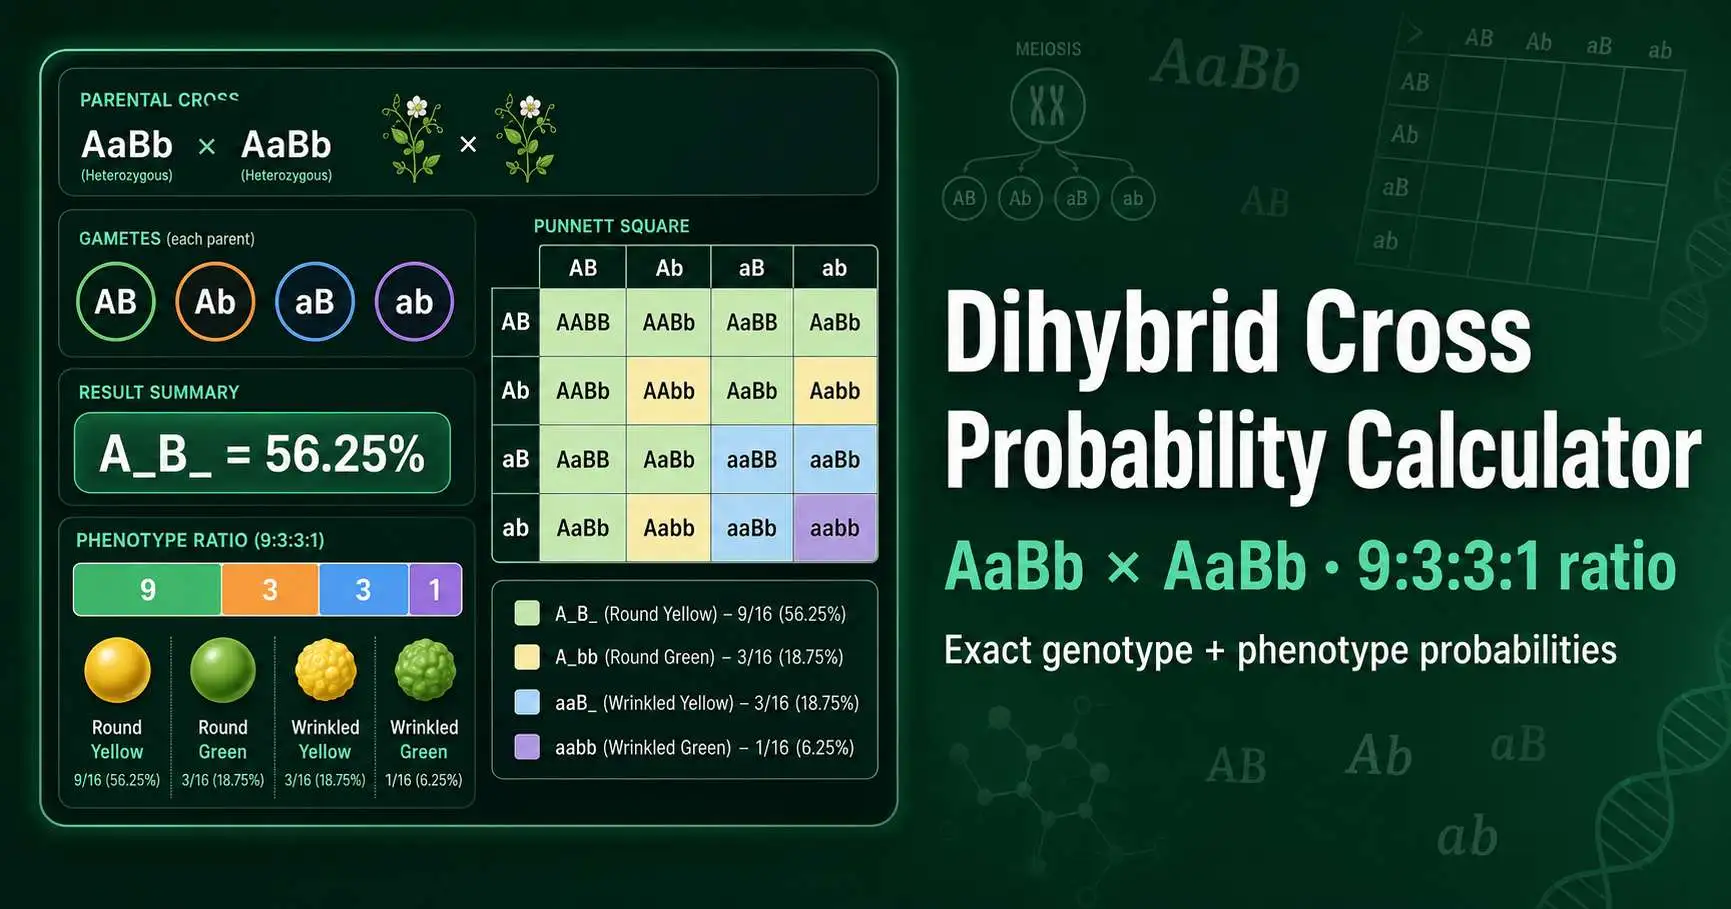
A dihybrid cross follows two genes at the same time. Gregor Mendel used pea plants to study paired traits such as seed shape and seed colour, then described independent assortment from those patterns. His results showed that one trait can segregate without forcing the second trait to follow it.
Modern genetics connects that pattern to meiosis. Homologous chromosome pairs orient at metaphase I, and unlinked loci enter gametes in independent combinations. Nature Education describes independent assortment as the separation of different genes during reproductive-cell formation. Read the Nature Scitable definition.
In the classic AaBb × AaBb cross, each parent produces AB, Ab, aB, and ab gametes. Random fertilisation gives sixteen genotype cells. Complete dominance condenses those cells into four phenotype classes: A_B_, A_bb, aaB_, and aabb.
Type each genotype in AABB order, such as AaBb, Aabb, aaBb, or aabb.
Use labels such as round, wrinkled, yellow, and green, or replace them with your organism’s traits.
Select A_B_, A_bb, aaB_, aabb, or a custom dominant and recessive combination.
Review the fraction, percentage, Punnett grid, genotype list, and expected phenotype ratio.
The calculator reads the first two letters as the A locus and the last two letters as the B locus. Use uppercase letters for dominant alleles and lowercase letters for recessive alleles.
Dihybrid probability uses the product rule when two loci assort independently. If Aa × Aa gives a 3/4 chance of A_ and Bb × Bb gives a 3/4 chance of B_, the joint A_B_ probability equals 9/16. That same multiplication creates the largest class in the 9:3:3:1 ratio.
A Punnett grid shows the same calculation visually. Four gametes from one heterozygous parent cross with four gametes from the other parent. The sixteen cells show genotype combinations, while phenotype grouping turns those cells into ratios. You can also generate the full 4×4 grid in the main Punnett square calculator.
OpenStax Biology explains that the 9:3:3:1 dihybrid ratio can collapse into two separate 3:1 monohybrid ratios when dominance and independent assortment both apply. Review the OpenStax inheritance chapter.
| Cross | Gametes | Common ratio | Use case |
|---|---|---|---|
| AaBb × AaBb | AB, Ab, aB, ab from each parent | 9:3:3:1 | Classic F₂ dihybrid cross |
| AaBb × aabb | Four gametes from one parent | 1:1:1:1 | Dihybrid test cross |
| AaBb × Aabb | Four gametes by two gametes | 3:3:1:1 | Specific phenotype probability problems |
Each parent forms four gametes: AB, Ab, aB, and ab. Each gamete has a 25% probability. The A_B_ phenotype needs at least one dominant A allele and at least one dominant B allele.
The A locus gives A_ with probability 3/4. The B locus gives B_ with probability 3/4. Multiplying the two values gives 9/16, or 56.25%, for the double-dominant phenotype.
Parent 1 produces AB, Ab, aB, and ab gametes. Parent 2 produces Ab and ab gametes. The A locus acts like Aa × Aa, while the B locus acts like Bb × bb.
The probability of A_ equals 3/4. The probability of B_ equals 1/2. A round yellow offspring under this label set has probability 3/4 × 1/2 = 3/8, or 37.5%.
Classical symbols such as A and B hide real genes. In pea seed shape, Bhattacharyya and colleagues showed that the wrinkled phenotype comes from a transposon-like insertion in a gene encoding starch-branching enzyme I. That paper linked Mendel’s seed texture trait to starch biosynthesis. View the PubMed record.
Seed colour also has a molecular explanation. Sato and colleagues reported that Mendel’s green cotyledon phenotype involves a stay-green gene that affects chlorophyll degradation. The visible yellow-versus-green trait therefore connects a classroom ratio with plastid pigment metabolism. Read the stay-green gene study.
Students use dihybrid probability to solve textbook crosses without drawing every cell by hand. Teachers use the same calculations to explain why phenotype ratios need large sample sizes. A class may observe 8:4:3:1 in a small vial and still study the 9:3:3:1 expectation.
Breeders use two-locus reasoning when they track visible traits in plants, animals, or microbes. The model works best when loci assort independently, dominance stays complete, and every genotype has similar viability. When those assumptions fail, the observed data can point toward linkage, epistasis, selection, or incomplete penetrance.
This calculator assumes complete dominance at both loci. It does not model incomplete dominance, codominance, epistasis, sex linkage, cytoplasmic inheritance, or lethal genotype classes. Those patterns change phenotype ratios and need different rules.
The tool also assumes independent assortment. Linked loci can produce parental gametes more often than recombinant gametes. Use recombination frequency when a problem gives map distance in centimorgans.
This calculator supports genetics education and experimental planning. It does not provide clinical genetic counselling, diagnosis, or medical risk prediction.
Use these tools to connect predicted dihybrid probabilities with observed offspring data.
Test observed offspring counts against expected ratios such as 9:3:3:1 and 1:1:1:1.
Open CalculatorBuild genotype grids for monohybrid and dihybrid crosses before solving probability questions.
Open CalculatorPractice genetics crosses online with instant feedback, scores, and printable worksheets.
Open CalculatorExtend the same probability logic to three genes and AaBbCc crosses.
Open Calculator