D' vs r²: Which LD Measure Should You Use?
D prime and r squared both measure linkage disequilibrium, but they answer different questions. Use D prime when you care about recombination history and haplotype blocks. Use r squared when you care about how well one variant predicts another, which is what genome-wide association studies need. Picking the wrong one, or assuming they agree, is a common mistake.
This guide explains the difference plainly. It covers what each measure captures, why they often disagree, a worked case where one is high and the other near zero, and a simple rule for which to use. Both come from the same D coefficient, covered in our guide on how to calculate linkage disequilibrium, so the contrast is about interpretation, not different math from scratch.
What Each Measure Captures
Both measures start from D, the raw linkage disequilibrium coefficient, and both range from zero to one in absolute value. The difference is what they normalize against, and that changes what they mean.
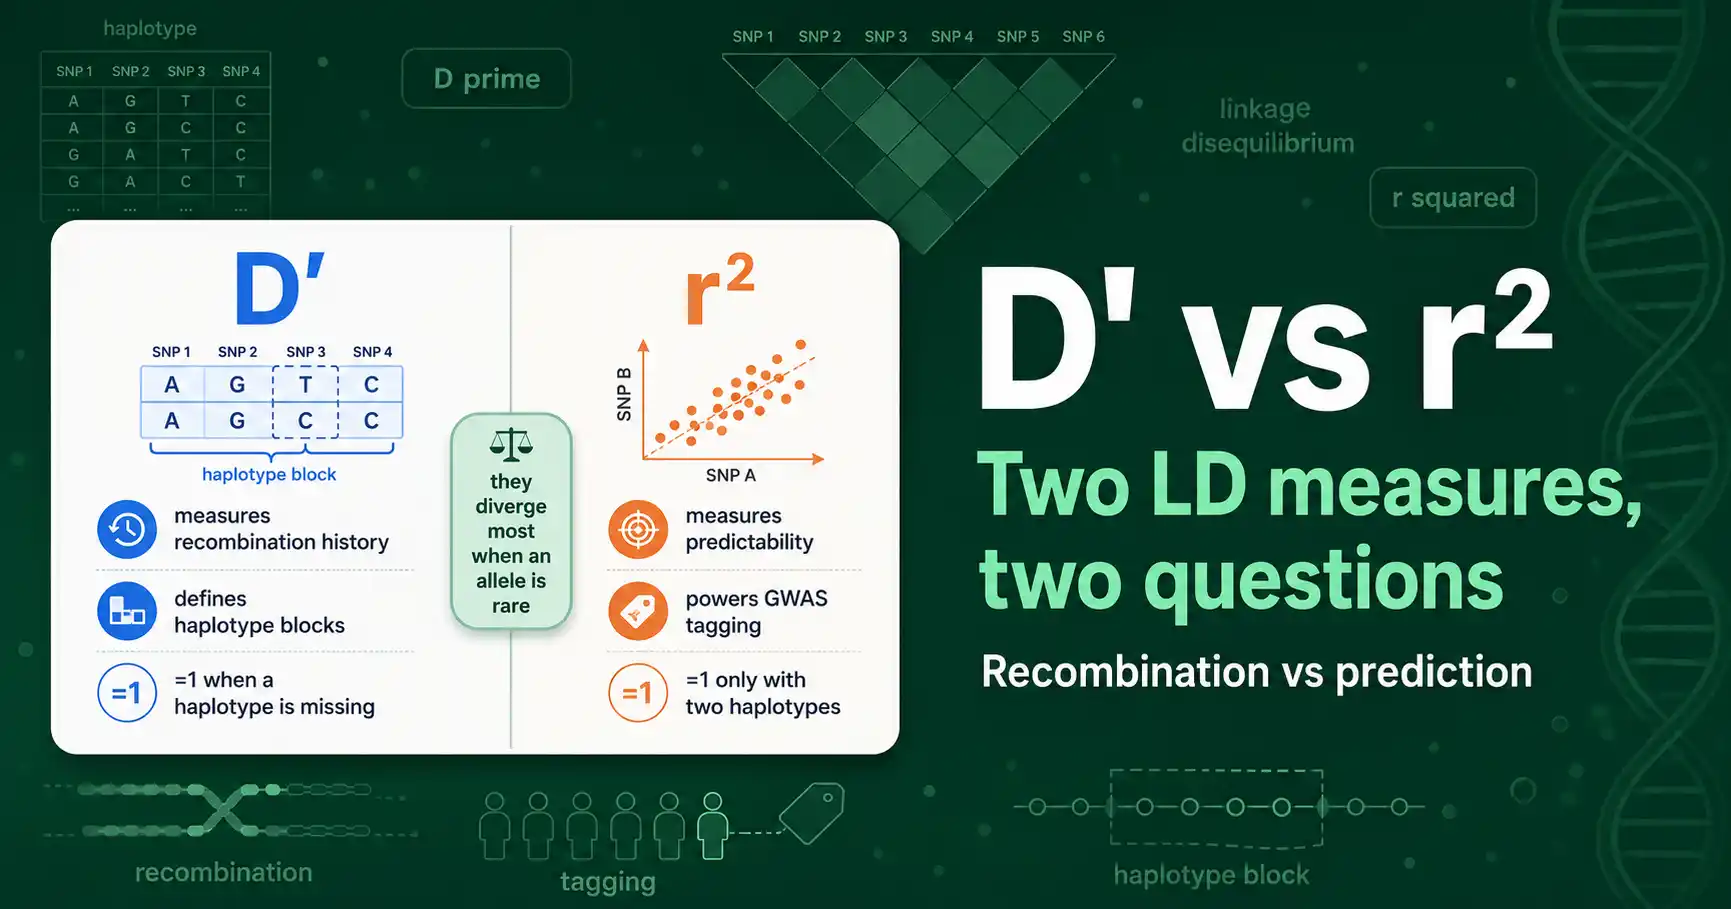
D prime divides D by the maximum value it could reach given the allele frequencies. Because of how that maximum is defined, D prime equals one whenever at least one of the four possible haplotypes is missing. A missing haplotype means recombination has not yet shuffled the alleles into every combination, so D prime of one signals an absence of recombination between the loci. When all four haplotypes are present, D prime drops below one, evidence that recombination has occurred. D prime, in short, measures recombination history.
R squared is the squared correlation between the two loci. It equals one only when exactly two of the four haplotypes exist, the case where knowing the allele at one locus tells you the allele at the other with certainty. R squared measures predictability: how reliably one locus stands in for the other. This is why it is the natural measure for tagging, where a genotyped marker is meant to predict an untyped causal variant.
So the two measures ask different questions of the same data. D prime asks "has recombination separated these loci?" R squared asks "does one locus predict the other?" Those are related but distinct, which is why the numbers can diverge.
It helps to notice what each measure is willing to ignore. D prime ignores allele frequencies entirely, by design, so it can declare complete LD whether the alleles are balanced or wildly skewed. R squared refuses to ignore them, because prediction genuinely depends on frequency: you cannot reliably predict a rare allele from a common one, and r squared honestly reports that limit. Whether that frequency sensitivity is a feature or a bug depends on your question, which is the whole reason the choice between them is not automatic.
Why They Disagree
The two measures part ways most dramatically when allele frequencies are unequal, especially when one allele is rare. Understanding this is the key to reading LD correctly.
The reason is structural. D prime reaches one as soon as any haplotype is missing, regardless of allele frequencies. R squared can reach one only when the two loci have matching allele frequencies and exactly two haplotypes exist. When one allele is rare, that condition fails, so r squared stays low even when a haplotype is missing and D prime is one. The rare allele caps how well one locus can predict the other, which is exactly what r squared registers and D prime ignores.
This frequency dependence was characterized precisely by Jenna VanLiere and Noah Rosenberg in a 2008 paper in Theoretical Population Biology, which mapped how the maximum possible r squared varies across the space of allele frequencies. Earlier, Philip Hedrick had shown in a 1987 paper in Genetics that D prime is the one common LD measure whose range stays frequency-independent, running from negative one to one regardless of how common the alleles are. That frequency independence is both D prime's strength, for detecting recombination, and its weakness, for judging predictability, because it can read as complete LD a situation where one locus barely predicts the other.
A Case Where They Split
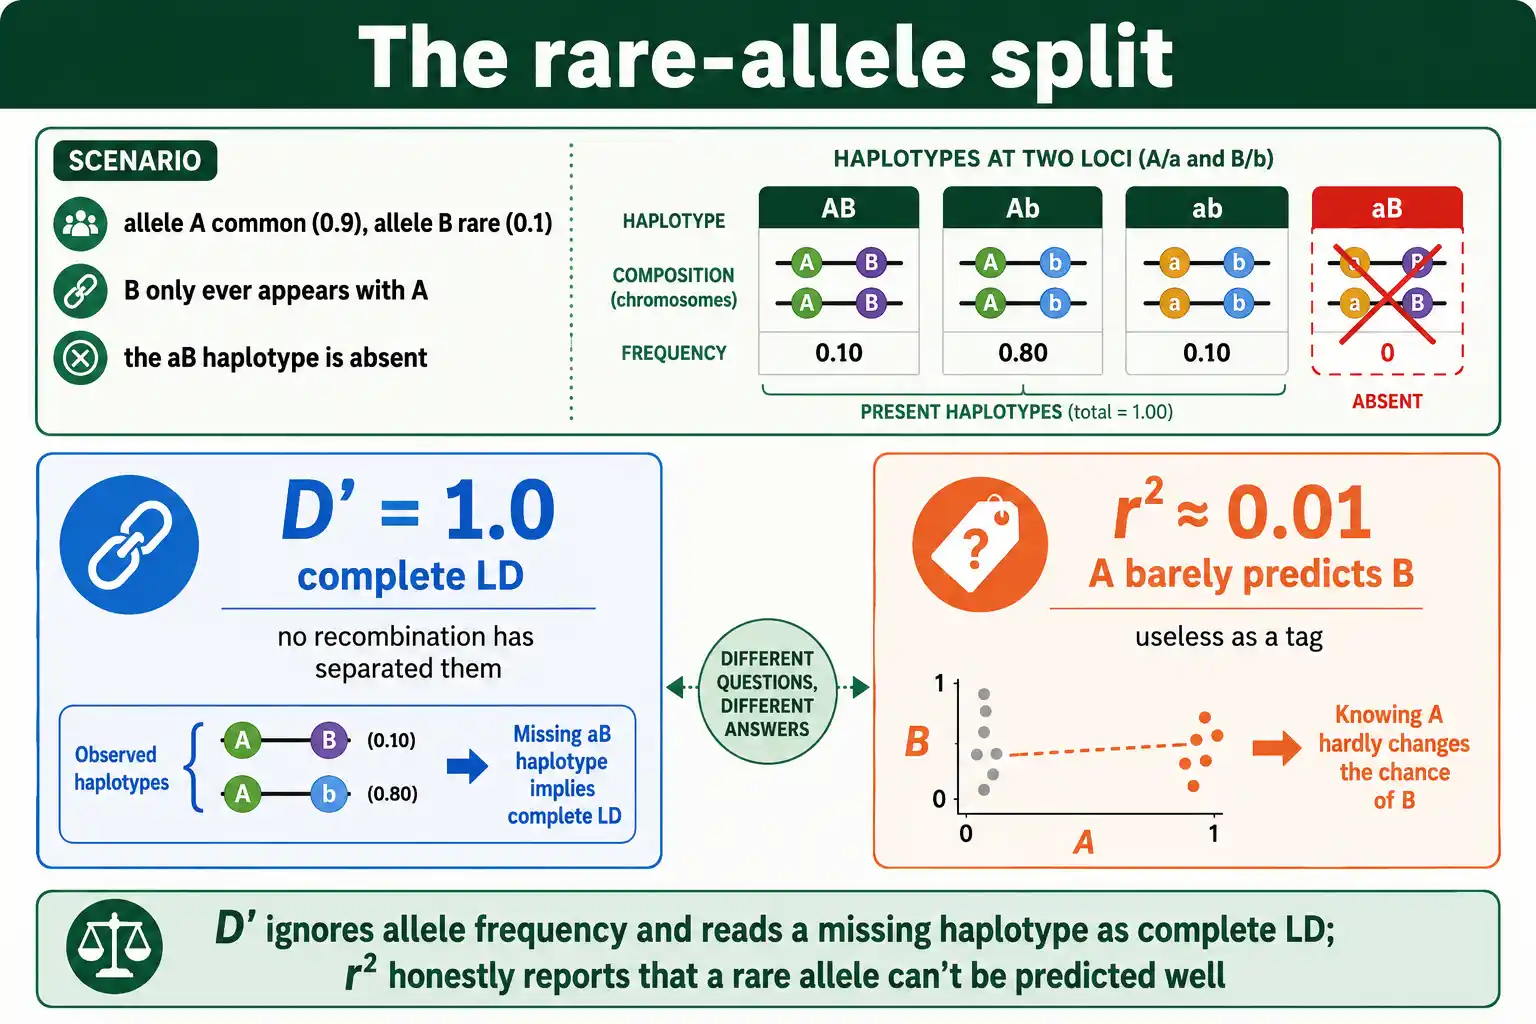
Numbers make the divergence concrete. Imagine two loci where allele A is common at 0.9 and allele B is rare at 0.1, and the rare allele B only ever appears alongside A, never alongside a. One haplotype, the one pairing a with B, is completely absent.
Because a haplotype is missing, D prime is one: complete LD by that measure. No recombination has separated these loci. But r squared tells a different story. Since B is rare and tied to the common A, knowing someone carries A barely narrows down whether they carry B, because most A carriers still have b. The correlation is weak, so r squared comes out near zero, perhaps 0.01.
The same locus pair is therefore both in complete LD and almost no LD, depending on the measure. Neither is wrong. D prime correctly reports that recombination has not broken these loci apart. R squared correctly reports that one locus is a poor predictor of the other. A researcher who saw only the D prime of one might assume the marker is a great tag for the rare variant, when r squared shows it would be nearly useless for that purpose. This is the single most important pitfall the two measures create, and it appears constantly with rare variants.
The practical damage is concrete. Suppose you are designing a study and want a cheap marker to stand in for a rare causal variant. If you select markers by D prime, you might pick this one, see complete LD, and expect it to capture the causal signal, then find your study has almost no power to detect the association, because the actual correlation, r squared, was near zero all along. Sample-size and budget decisions that lean on D prime when they should lean on r squared waste real resources. This is not a hypothetical: the move toward rare-variant studies has made the D-prime-high, r-squared-low trap more common, not less, because rarer alleles widen the gap between the two measures.
Side by Side
The contrast is easiest to hold in a table.
| Property | D prime | r squared |
|---|---|---|
| Measures | Recombination history | Predictability / correlation |
| Equals 1 when | Any one haplotype is missing | Exactly two haplotypes present |
| Frequency dependence | Independent of allele frequencies | Strongly affected by allele frequencies |
| Best use | Defining haplotype blocks, detecting recombination | GWAS tagging, imputation, association power |
| Behavior with rare alleles | Can be 1 even when prediction is poor | Stays low, reflecting weak prediction |
| Inflated by small samples | Yes, easily | Less so |
The table shows why both measures persist instead of one winning. They are tuned to different jobs. D prime is built to detect whether recombination has occurred; r squared is built to measure statistical correlation. There is even a tidy mathematical link between them: across most of the allele-frequency space, r squared divided by its own maximum equals D prime squared, so they are two views of one underlying quantity rather than rivals.
What Each Looks Like on an LD Plot
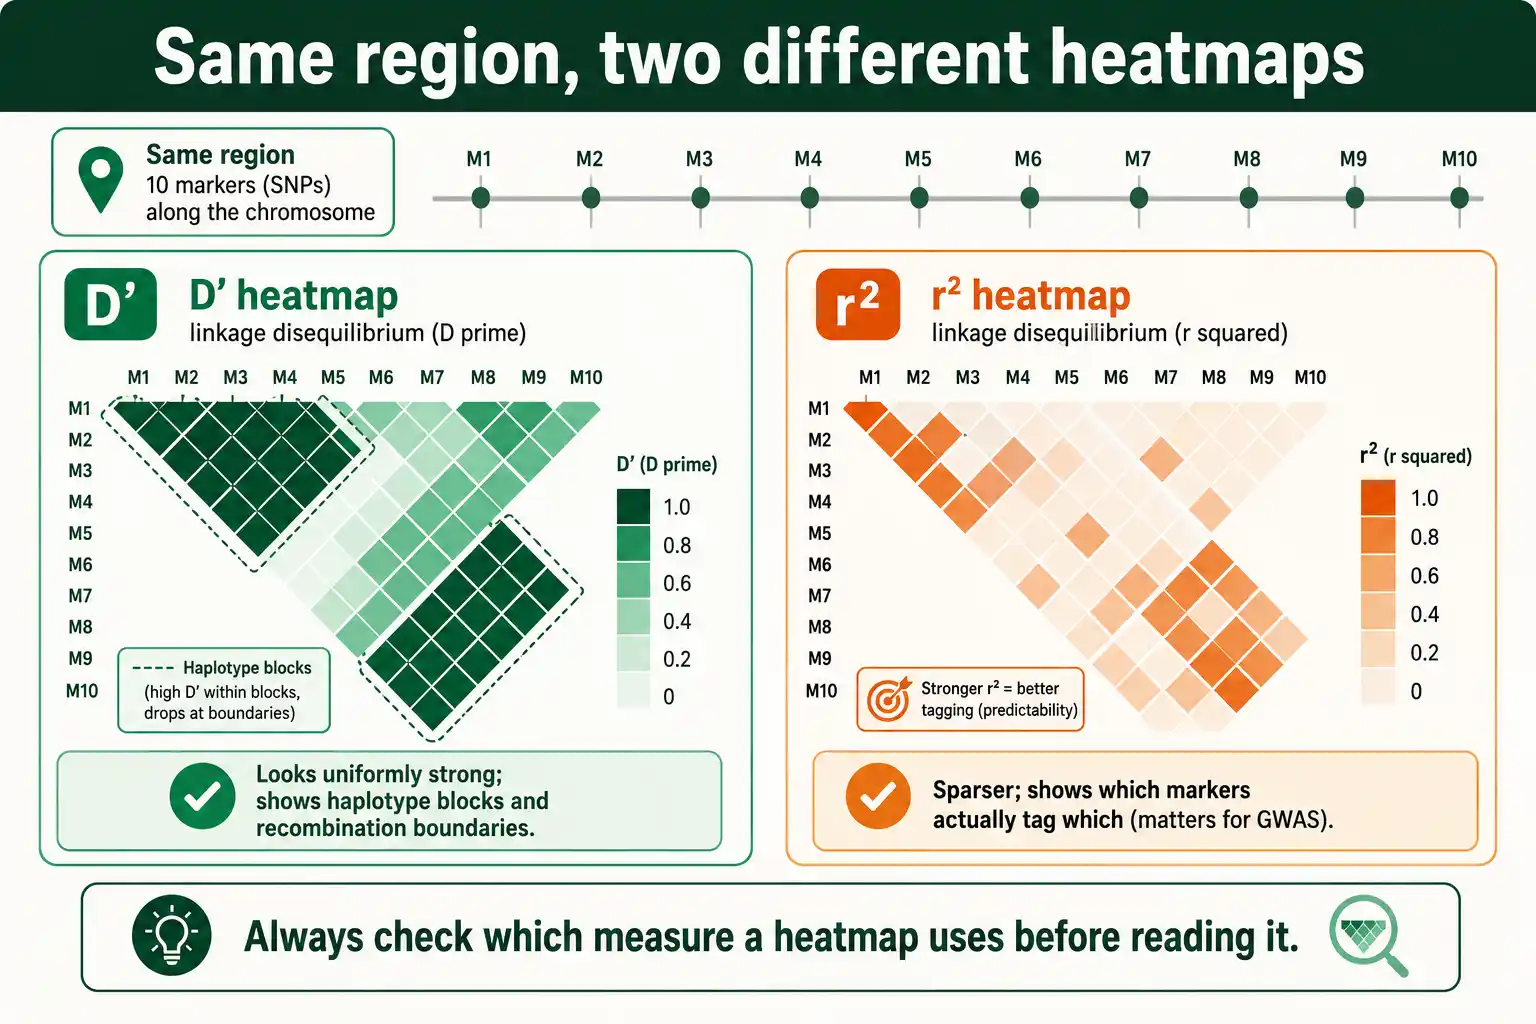
In practice, researchers rarely read single D prime or r squared values; they look at LD heatmaps covering many loci at once. The two measures produce strikingly different-looking plots of the same region, and knowing which you are looking at matters.
An LD heatmap is a triangular grid where each cell shows the LD between a pair of markers, shaded by intensity. Plotted with D prime, these maps tend to look uniformly dark, full of high values, because D prime hits one so readily, even between loci where one allele is rare. The familiar blocks-and-boundaries picture of haplotype structure, where regions of strong LD are separated by recombination hotspots, is usually drawn from D prime, since it tracks recombination.
Plotted with r squared, the same region looks patchier and generally lighter, because r squared only lights up for locus pairs with similar allele frequencies and strong correlation. This sparser picture is the one that matters for association studies, because it shows which markers genuinely tag which others. A researcher who confuses the two plots can badly misjudge a region: a D prime heatmap can suggest dense, strong LD across a block that an r squared heatmap reveals to be poorly tagged. Reading the legend to see which measure a heatmap uses is a basic but frequently skipped step.
The Hidden Link Between Them
Although D prime and r squared can diverge widely, they are not unrelated. A precise mathematical bridge connects them, which helps explain why both are valid.
VanLiere and Rosenberg showed that across most of the space of possible allele frequencies, r squared divided by its own maximum possible value equals D prime squared, a relationship that held for roughly 73 percent of the allele-frequency space in their analysis. In words, once you account for the ceiling that allele frequencies impose on r squared, the two measures carry much the same information about how far recombination has progressed. The divergence between them is not a contradiction; it is the visible effect of that frequency-dependent ceiling on r squared.
This is why the gap between a high D prime and a low r squared is so diagnostic. It is not noise. It is the signature of unequal allele frequencies, usually a rare allele at one of the loci, pressing r squared down below the level its recombination history alone would set. Seen this way, the two measures are complementary instruments reading the same underlying disequilibrium through different filters, which is exactly why thoughtful analyses report both.
Which One to Use
The choice comes down to your question, and a simple rule covers almost every case.
Use r squared for anything involving prediction. Genome-wide association studies depend on it, because a tag SNP only works if it predicts the causal variant, and r squared is the measure of that prediction. R squared also has a direct, practical payoff: the sample size needed to detect an association through a tag SNP scales inversely with r squared, so a tag with r squared of 0.8 needs only slightly more samples than genotyping the causal variant directly, while a tag with r squared of 0.2 needs five times as many. Imputation, LD pruning, and association power all run on r squared for the same reason.
Use D prime for anything involving recombination and haplotype structure. Defining the boundaries of haplotype blocks, regions of low internal recombination, relies on D prime, because the question is whether recombination has broken the region up. Detecting historical recombination and studying the breakdown of LD over a region also call for D prime. If your interest is the population-genetic history written in the LD pattern, D prime is usually the right lens, a theme our guide on LD decay and recombination develops.
When in doubt, report both. They are cheap to compute together, and the gap between them is itself informative: a high D prime with a low r squared flags a rare allele or unequal frequencies, exactly the situation where reporting only one would mislead. Most careful LD analyses present both, and you can generate both at once for any haplotype data with an LD calculator that returns D, D prime, and r squared together.
Frequently Asked Questions
Why is r squared low when D prime is high?
Because the two measure different things. D prime reaches one whenever a haplotype is missing, regardless of allele frequencies, while r squared measures how well one locus predicts the other. When one allele is rare, a haplotype can be absent, pushing D prime to one, yet the rare allele still makes prediction poor, keeping r squared low. This pattern is common with rare variants.
Which LD measure should I use for GWAS?
Use r squared. Genome-wide association studies rely on tag SNPs predicting nearby causal variants, and r squared measures exactly that predictive correlation. It also has a direct relationship with statistical power: the sample size needed to detect an association scales inversely with the r squared between the tag and the causal variant.
The Bottom Line
D prime and r squared are not competing estimates of one thing; they are two measures answering two questions. D prime captures recombination history, reaching one whenever a haplotype is missing, and it is the tool for defining haplotype blocks and detecting recombination. R squared captures predictability, reaching one only when one locus perfectly predicts the other, and it is the tool for GWAS tagging, imputation, and association power.
They diverge most when an allele is rare, where D prime can read as complete LD while r squared stays near zero, the pitfall worth watching for above all. The practical rule is simple: prediction means r squared, recombination means D prime, and when unsure, report both and read the gap between them. To see what generates these patterns in the first place, our guide on what causes linkage disequilibrium covers the forces behind the numbers.