Fst in Human Populations and Ancestry
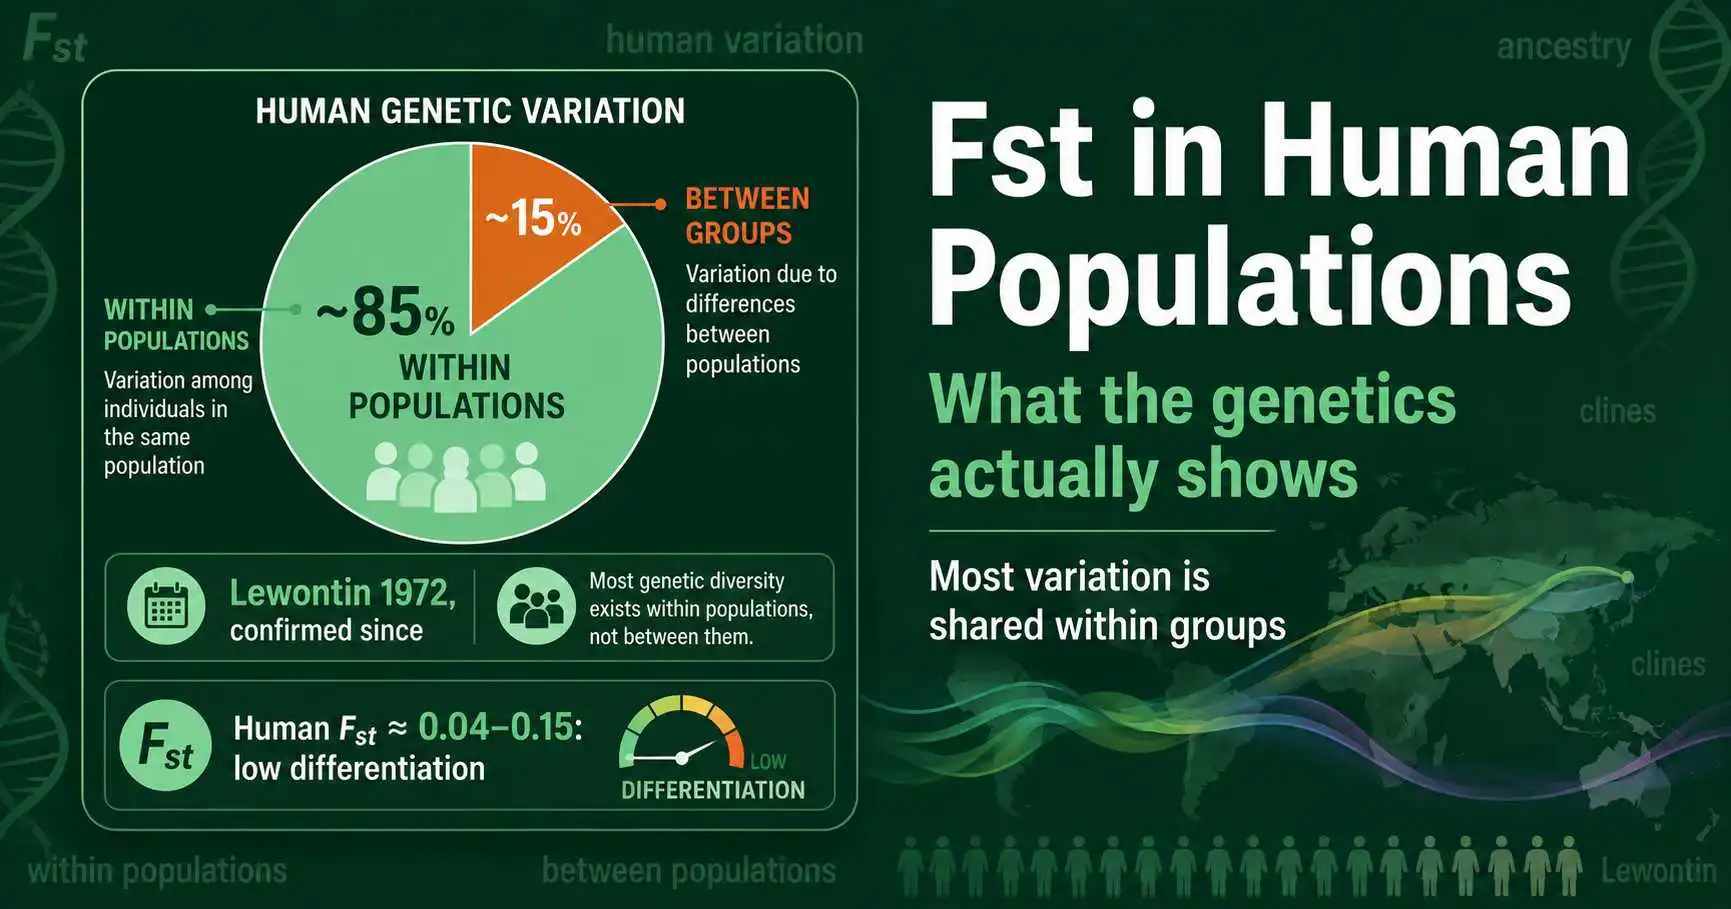
Among the things Fst is used to study, human genetic variation is the most discussed and the most prone to misunderstanding. The central scientific finding is clear and has held up consistently for fifty years: most human genetic variation, around 85 percent, exists within populations rather than between them. Fst among major human groups is low, sitting in the range Sewall Wright would have called little to moderate differentiation, well below the levels seen between subspecies in many other animals. At the same time, the small between-group differences that do exist are real, measurable, and genuinely useful for studying ancestry, human migration, and the history of our species.
This article lays out what the peer-reviewed literature actually shows. It covers Richard Lewontin's foundational apportionment of human diversity, the continental Fst figures from large genomic datasets, what ancestry means in genetic terms, and an important scientific debate about how to interpret these numbers. The aim throughout is accuracy: stating carefully what the data support and what they do not. If you want the general background on the statistic first, our explainer on what Fst is covers the foundation.
Lewontin's Foundational Finding
In 1972, the geneticist Richard Lewontin published a paper titled "The apportionment of human diversity" that reshaped how scientists describe human variation. Using 17 classical protein markers, the best data available at the time, he partitioned human genetic diversity into components: variation within populations, variation among populations within a major group, and variation among major groups.
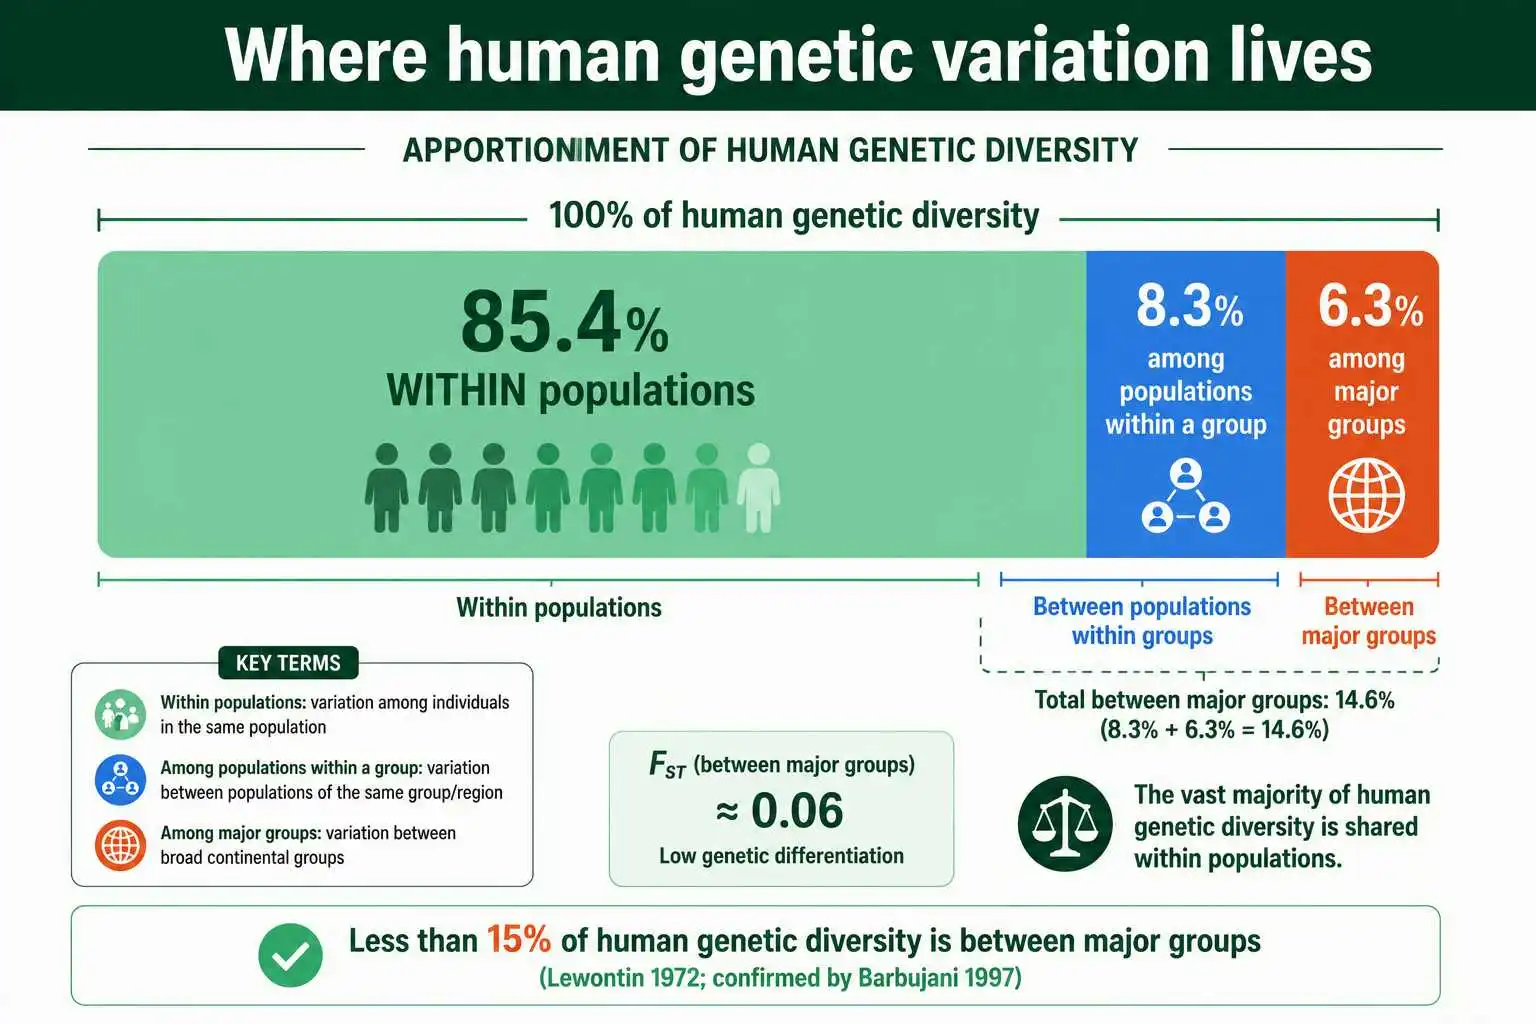
His result was striking enough that he punctuated it with an exclamation mark. Lewontin found that 85.4 percent of total human genetic diversity is contained within populations, 8.3 percent is among populations within a so-called race, and only 6.3 percent is accounted for by differences among the major groups themselves. In his words, less than 15 percent of all human genetic diversity is explained by differences between human groups. From this he concluded that conventional racial classification has little genetic or taxonomic significance.
What makes the finding durable is that later studies using vastly better data confirmed it. When Guido Barbujani and colleagues repeated the analysis with DNA markers in a 1997 paper in the Proceedings of the National Academy of Sciences, they found about 84.5 percent of variation within populations, almost exactly Lewontin's figure. Lewontin reportedly joked that the agreement was closer than any scientist is entitled to expect. The roughly 85 percent within-population figure has proven remarkably stable across markers and methods, and it remains the single most cited fact about human genetic variation. These apportionment proportions are conceptually close cousins of Fst, both partitioning diversity into within- and between-group components, as Michael Edge, Sohini Ramachandran, and Noah Rosenberg noted in a 2022 retrospective in Philosophical Transactions of the Royal Society B marking the finding's fiftieth anniversary.
What the Fst Numbers Say
Translated into Fst, the apportionment finding corresponds to low values among human groups, though the exact figure depends on the method, the markers, and how populations are defined.
The widely cited analysis by Noah Rosenberg and colleagues in 2002, using hundreds of microsatellite markers across worldwide populations, reported an Fst of roughly 0.046 among continental clusters, and about 0.036 under finer population subdivisions. Both sit firmly in Wright's lowest band, indicating little differentiation. Estimates from single-nucleotide polymorphism datasets vary with the method: figures for pairs of continental groups range from around 0.05 to 0.15 depending on the populations compared and the estimator used, with European versus East Asian comparisons often near 0.05 to 0.11 and European versus West African comparisons somewhat higher. The variation in these published numbers reflects estimator and sampling differences, a point examined in our guide on Fst values and what counts as high or low, rather than disagreement about the underlying biology.
For comparison, this human range is low. Many animal species show Fst values between subspecies far above 0.25, and a conventional threshold sometimes invoked in zoology for recognizing subspecies sits around that level. Human continental groups fall well short of it. So whether measured as Lewontin's apportionment or as Wright's Fst, the conclusion converges: human populations differ genetically, but the differences are modest, and the bulk of human variation is shared across all populations.
It is worth noting why the apportionment percentages and the Fst values line up. Lewontin's "proportion of variation between groups" and Fst are measuring fundamentally the same thing through slightly different lenses, one using a diversity measure related to entropy and the other using heterozygosity. Both express the fraction of total genetic variation attributable to differences among groups rather than within them. So Lewontin's roughly 10 to 15 percent between-group figure and Rosenberg's Fst of around 0.04 to 0.05 are not competing numbers; they are the same finding computed under different definitions and population groupings. The convergence across half a century of data, different markers, and different statistics is what gives the conclusion its unusual robustness.
What Ancestry Means Genetically
If between-group differences are small, how can genetic ancestry tests work at all? The answer reveals something important about how human variation is structured, and it resolves an apparent paradox.
Genetic ancestry is real and inferable because, although any single genetic marker differs only slightly between populations on average, the small differences across thousands or millions of markers add up. Allele frequencies vary subtly from place to place, and by combining information across the whole genome, methods can assign individuals to populations or estimate the proportions of their ancestry with high accuracy. A single marker tells you almost nothing about where someone is from; a million markers together tell you a great deal. This is why ancestry inference and the 85-percent-within finding are both true at once: the within-population majority holds at each individual locus, while the cumulative signal across loci still permits accurate classification.
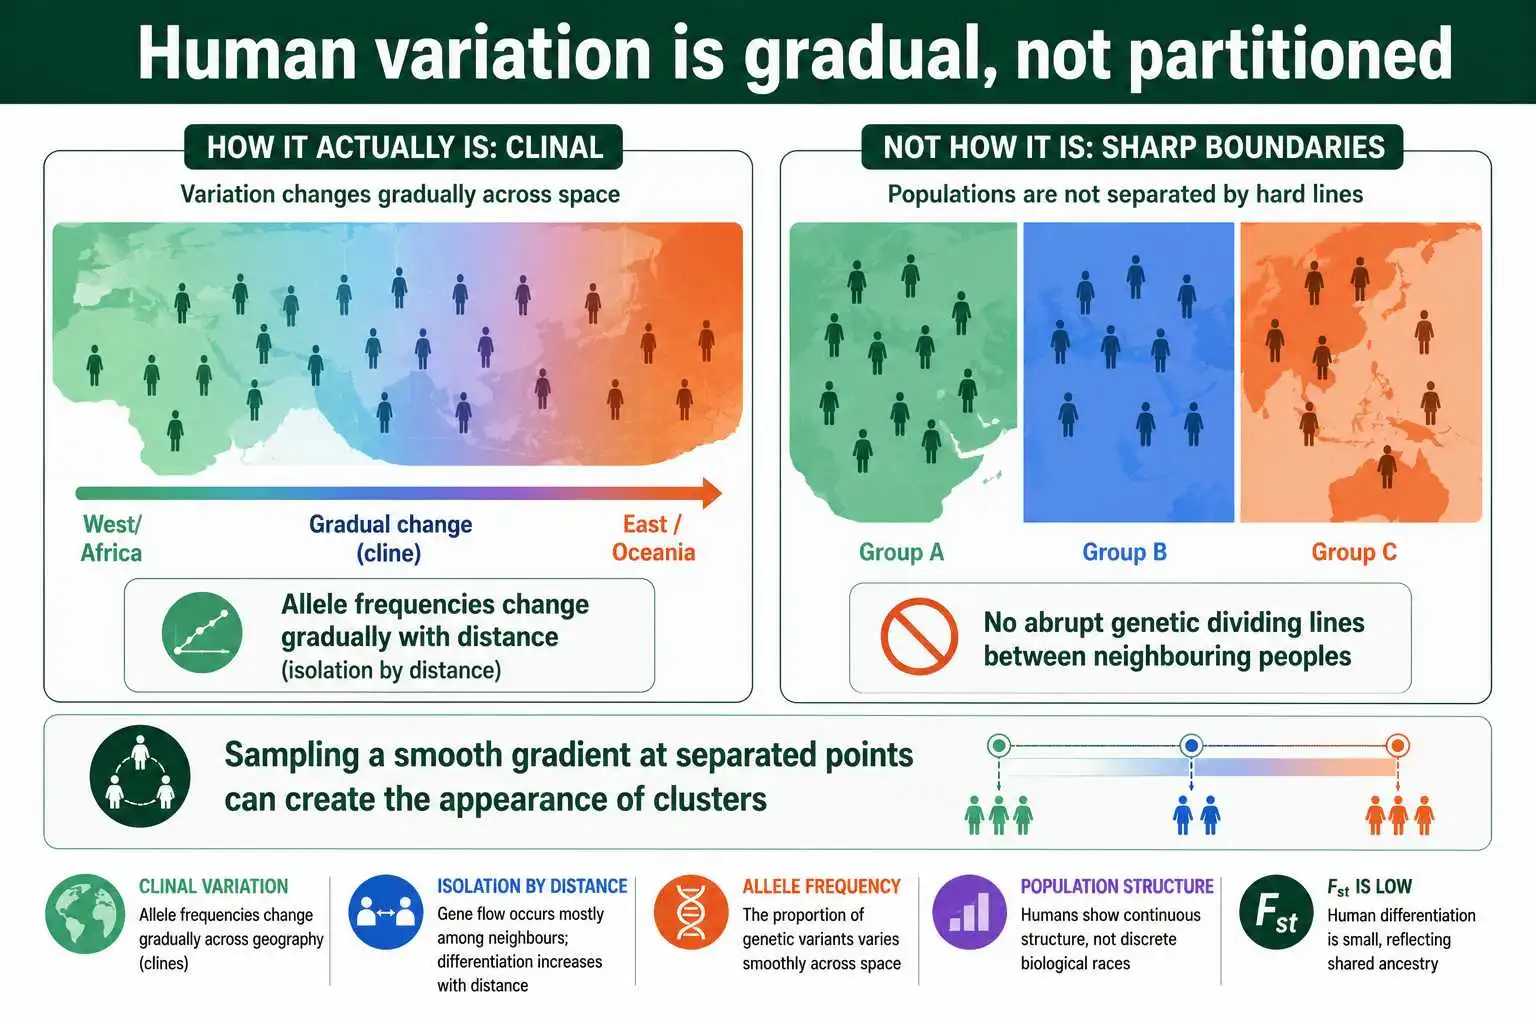
Crucially, human genetic variation is largely clinal, meaning it changes gradually across geography rather than in sharp jumps. Allele frequencies shift smoothly with distance, producing the isolation-by-distance pattern seen worldwide, where genetic differentiation rises steadily with geographic separation from East Africa. Because the variation is gradual, the "clusters" that ancestry methods identify depend partly on how populations are sampled. As work by David Serre and Svante Pääbo and others showed, sampling people from across a continuous gradient yields smooth ancestry gradients, while sampling from widely separated locations can produce the appearance of discrete clusters. The clusters are useful descriptions of real structure, but they are summaries of an underlying continuum, not natural dividing lines.
What Clustering Studies Found
Beyond apportionment, a major line of research used clustering algorithms to ask whether human genetic data fall into identifiable groups, and the results refined rather than overturned the apportionment picture.
The influential approach used a program called STRUCTURE, which assigns individuals to a specified number of ancestral clusters based on their genotypes without being told in advance where anyone is from. When Noah Rosenberg and colleagues applied this to worldwide samples in 2002, the algorithm recovered clusters that broadly corresponded to major geographic regions, a result often cited as evidence that population structure is genetically detectable. What is sometimes missed is what the same studies also showed: the number of clusters is set by the researcher, the clusters blend into one another at their geographic boundaries, and many individuals show mixed ancestry across clusters. The structure is real, but it is graded, not partitioned.
Later work deepened this picture, particularly regarding Africa, the continent with by far the most human genetic diversity. A landmark 2009 study led by Sarah Tishkoff analyzed thousands of Africans from over a hundred ethnic groups and found extensive substructure within the continent, with multiple ancestral clusters tied to ethnolinguistic groups. This matters for interpreting Fst: because so much human diversity resides within Africa, treating any single continental group as genetically uniform is inaccurate. The within-population majority that Lewontin identified holds within continents as well as globally. Clustering, in short, detects genuine geographic structure while confirming that human variation is continuous and that within-group diversity dominates.
The Intuition Behind the Numbers
It helps to build an intuition for how most variation can be within groups while ancestry remains inferable, because the two facts feel contradictory until the logic clicks.
Picture a single genetic variant. In one population the version of it might be present in 60 percent of people, and in another population in 45 percent. That is a real difference, but it is a difference in frequency, not in kind: both versions exist in both populations, just in slightly different proportions. Pick two random people from the same population and two from different populations, and at this one variant they are nearly as likely to match in either case. This is the within-population majority in action at a single locus, and it is why no single gene marks a population boundary.
Now consider thousands of such variants together. At each one, the frequency difference between populations is small, but the differences point consistently in the same direction, reflecting the populations' shared and separate histories. Aggregated across the genome, these many small, correlated differences become a reliable signal of ancestry, even though no single one is decisive. This is precisely the reconciliation of Lewontin and Edwards: the per-locus view shows mostly shared variation, while the whole-genome view extracts a faint but consistent pattern. Both descriptions are accurate, and seeing them as compatible rather than contradictory is the key to reading the human Fst literature correctly.
A Genuine Scientific Debate
A long-running scientific discussion sharpens what these numbers mean, and presenting it honestly is part of an accurate account. The debate concerns whether the low Fst and the 85-percent finding tell the whole story.
In 2003, the statistician A. W. F. Edwards published a paper arguing that Lewontin's conclusion contained a statistical subtlety, sometimes called "Lewontin's fallacy." Edwards pointed out that even when each individual locus shows mostly within-population variation, the correlations among many loci can still allow individuals to be classified into groups with high accuracy. In other words, low single-locus Fst does not imply that populations are indistinguishable when many loci are considered together. The clustering studies confirmed this: with enough markers, individuals can indeed be assigned to broad geographic clusters reliably.
The resolution, articulated by many population geneticists since, is that Lewontin and Edwards were answering different questions, and both were correct about their own. Lewontin's apportionment correctly describes how genetic variation is distributed, that most of it is shared and between-group differences are small in magnitude. Edwards correctly noted that small differences, aggregated across the genome, still carry enough information to classify ancestry. Neither point overturns the other. What both agree on, and what the data show, is that human groups are genetically similar in degree while still being statistically distinguishable, and that the variation is clinal rather than carved into discrete biological types. The 2022 Royal Society collection marking fifty years since Lewontin's paper, including a review by Mark Jobling, worked through exactly these distinctions, concluding that the apportionment finding remains sound while acknowledging the classifiability point.
Fst Outliers and Human Adaptation
While genome-wide human Fst is low, certain individual genes show much higher Fst between populations, and these outliers tell a specific story about adaptation rather than overall difference.
A handful of genes stand far above the genome-wide background because they were targets of strong local natural selection. The pigmentation gene SLC24A5 shows a very high Fst between European and African populations, reflecting selection on skin color. The lactase gene LCT shows elevated Fst in populations with long histories of dairy farming, where the ability to digest milk in adulthood was favored. And the gene EPAS1 shows a dramatic Fst between Tibetan highlanders and lowland populations, a now-classic signal of adaptation to low oxygen at altitude. These cases are exceptions that prove the rule: they stand out precisely because the genome-wide background is so uniform. A high Fst at a single adaptive gene, against a low overall average, reflects a specific selective pressure, not broad genetic divergence between populations.
This distinction matters for interpretation. The visible traits that people often associate with population differences, such as skin color, are governed by a small number of genes under strong selection and are therefore unrepresentative of the genome as a whole. Most of the genome, the neutral majority that Fst measures across the board, shows the low differentiation that Lewontin described. Judging overall genetic difference by a few visible, selected traits is exactly the mistake the apportionment data correct.
This is also why the genome-wide Fst and the single-gene Fst must never be conflated. A statement like "populations differ at gene X with an Fst of 0.7" is true for a handful of strongly selected loci, but it describes those specific genes, not the genome as a whole, where the typical Fst is an order of magnitude lower. Honest reporting distinguishes the rare adaptive outlier from the overwhelming neutral background, because collapsing the two is how selective examples get used to imply a divergence that the full genome does not show.
Why This Matters for Medicine and Research
The structure of human genetic variation has real consequences for genetics research and medicine, where ancestry information is genuinely useful when handled carefully.
Ancestry matters medically because allele frequencies, including those of disease-associated variants, differ somewhat between populations. Some genetic conditions are more common in particular ancestral groups, often through founder effects or local selection, and accounting for ancestry improves the accuracy of genetic risk prediction and the interpretation of clinical tests. Genome-wide association studies must account for population structure to avoid spurious results, and polygenic risk scores developed in one population often transfer poorly to others, a recognized equity problem in genomics that traces directly to these patterns of variation.
The polygenic risk score issue deserves a closer look, because it shows how population structure has practical stakes. A polygenic risk score sums the effects of many genetic variants to estimate a person's predisposition to a trait or disease. These scores are overwhelmingly built from studies of people of European ancestry, simply because those datasets are largest. When such a score is applied to someone of African or East Asian ancestry, its accuracy can drop substantially, because the variants and their effects were calibrated in a different genetic background, with different allele frequencies and patterns of linkage. The result is that the people who already have the least genomic data risk benefiting least from genomic medicine, and closing that gap requires deliberately studying diverse populations. The low overall human Fst does not make this problem disappear; the small frequency differences across the genome are exactly what cause scores to mistransfer.
This also illustrates why genetic ancestry, estimated directly from data, is more useful than social labels in research. Two people who identify with the same social category may have quite different genetic ancestry, and two people with similar genetic ancestry may identify differently. For the purpose of interpreting allele frequencies and risk variants, it is the measured genetic ancestry that carries the biological information, which is why modern studies estimate it explicitly rather than relying on self-reported categories alone.
At the same time, the science cautions against treating broad social race categories as good proxies for genetic ancestry. Because variation is clinal and within-group diversity is large, social categories are imprecise stand-ins for the actual genetic ancestry that matters biologically, and conflating the two can mislead both research and clinical care. The responsible use of ancestry in medicine relies on genetic ancestry estimated from data, treated as continuous and population-specific, rather than on broad categorical labels. Anyone making personal medical decisions related to ancestry or inherited risk is best served by a genetic counselor or physician who can interpret the specifics for their own situation and family history.
Frequently Asked Questions
What percentage of human genetic variation is between populations?
Only about 15 percent. Richard Lewontin's 1972 study found that 85.4 percent of human genetic diversity exists within populations, with roughly 8 percent among populations within major groups and about 6 percent among the major groups themselves. Later DNA-based studies, including Barbujani and colleagues in 1997, confirmed the roughly 85 percent within-population figure.
Is human Fst high or low compared to other species?
Low. Fst among human continental groups is typically around 0.05 to 0.15 depending on method, with some estimates near 0.04, all within Wright's lowest bands. Many animal species show Fst above 0.25 between subspecies, a level human populations do not approach, indicating that human differentiation is modest by comparison.
What the Science Supports
The genetics of human Fst tells a consistent story across half a century of research. Most human genetic variation, about 85 percent, lies within populations rather than between them, a finding established by Lewontin in 1972 and confirmed many times since. Fst among human groups is correspondingly low, in Wright's little-to-moderate range and far below the levels seen between subspecies in many other animals. The differences that exist are real and measurable, and aggregated across the genome they allow accurate ancestry inference, but the underlying variation is clinal, changing gradually across geography rather than partitioning humanity into discrete biological types.
Holding both halves of that picture is what accuracy requires: human populations are genetically similar in degree yet statistically distinguishable when many loci are combined, with ancestry a real and useful continuous concept rather than a set of discrete categories. The high-Fst outlier genes for traits like pigmentation and altitude adaptation are specific products of local selection, not signs of broad divergence, and the visible traits they govern are unrepresentative of the genome overall. To see how these values are calculated from allele frequencies, the Fst population differentiation calculator performs the computation, and the forces that produced the low human differentiation in the first place, recent shared ancestry and pervasive gene flow, are explained in our guide on genetic differentiation and gene flow.