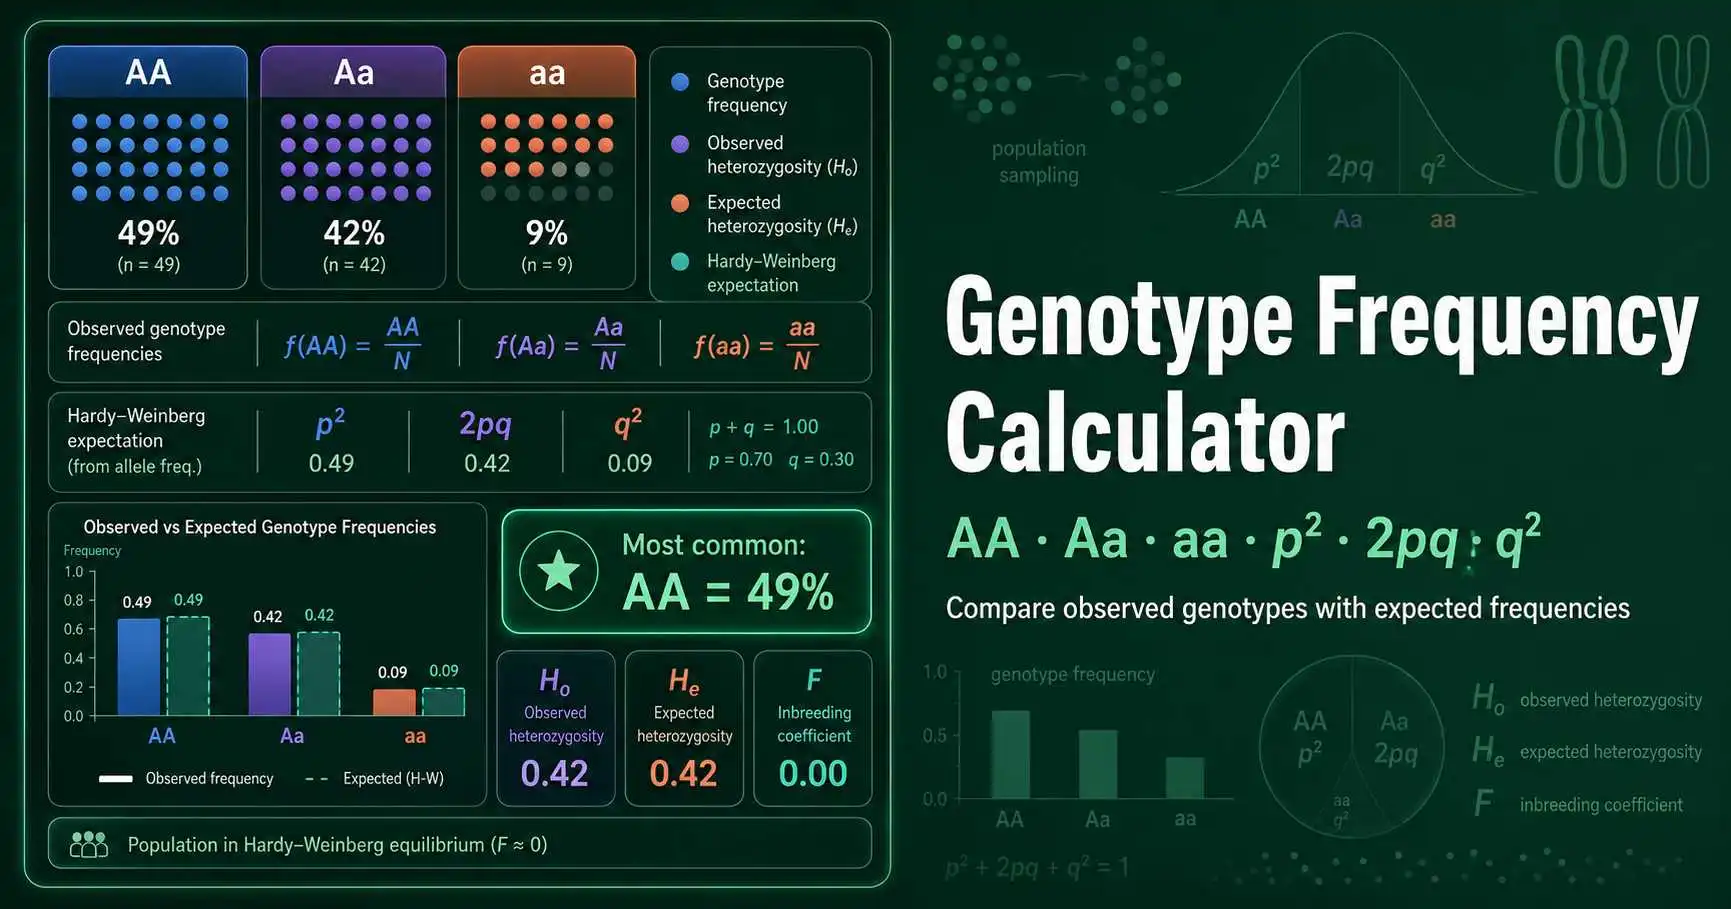
Genotype Frequency Calculator

Calculate AA, Aa, and aa genotype frequencies from observed counts. The tool also derives p and q, compares observed genotypes with p², 2pq, and q² expectations, and highlights heterozygote excess or deficit.

Live genotype frequency calculator for AA, Aa, and aa

Enter the observed genotype counts. The result cards update immediately and compare the distribution with Hardy-Weinberg genotype expectations.

Choose a genotype-frequency example

Start with a population pattern, then enter the genotype counts from your own class, marker panel, or breeding data.

Observed genotype counts

Enter the number of individuals observed in each genotype class.

Genotype-frequency formula

f(genotype) = genotype count / total individuals

Genotype distribution visual

Observed genotype frequencies for AA, Aa, and aaAAAaaa49.0%42.0%9.0%

Most common genotype: AA at 49.00%

The sample contains 100 individuals. Allele frequencies from these genotype counts are p = 0.7000 and q = 0.3000.

AA49.00%

Expected under p², 2pq, q²: 49.00%

Aa42.00%

Expected under p², 2pq, q²: 42.00%

aa9.00%

Expected under p², 2pq, q²: 9.00%

Observed heterozygosity

42.00%

Expected heterozygosity

42.00%

F = 1 − Ho/He

0.000

Observed versus expected genotype frequencies

AA

Observed49.00%
Expected49.00%

Aa

Observed42.00%
Expected42.00%

aa

Observed9.00%
Expected9.00%
Genotype frequency diagram comparing AA, Aa, and aa observed genotype proportions with Hardy-Weinberg expected proportions
Figure 1. A biallelic genotype distribution separates individual counts into AA, Aa, and aa classes. Those observed proportions can then be compared with p², 2pq, and q² expectations from the allele frequencies.

What is genotype frequency?

Genotype frequency measures the share of individuals that carry a specific genotype at one locus. In a biallelic diploid model, the three genotype classes are AA, Aa, and aa. Each genotype frequency equals its count divided by the total number of individuals.

Population genetics often compares observed genotype frequencies with Hardy-Weinberg expectations. The NCBI Bookshelf explains the core rule: homozygote proportions follow allele-frequency squares, while heterozygotes follow twice the product of the two allele frequencies. Read the NCBI Bookshelf population-genetics explanation.

A genotype-frequency table can reveal patterns that allele frequencies alone hide. A population can have p = 0.50 and q = 0.50, yet show too many heterozygotes or too many homozygotes. That is why genotype distribution matters for inbreeding, population subdivision, and marker quality checks.

What each part of Genotype Frequency Calculator does

Preset buttons

Load common patterns such as Hardy-Weinberg-like data, heterozygote excess, or heterozygote deficit.

Observed genotype inputs

Accept raw AA, Aa, and aa counts so the tool can calculate proportions correctly.

Distribution visual

Displays the relative size of genotype classes in a fast visual form.

Frequency bars

Shows each observed genotype frequency beside its expected Hardy-Weinberg value.

Heterozygosity cards

Compare observed Aa frequency with expected 2pq heterozygosity.

F estimate

Reports 1 − Ho/He as a compact heterozygote deficit or excess signal.

How to use Genotype Frequency Calculator

  1. 1

    Enter AA count

    Type the number of individuals with two A alleles.

  2. 2

    Enter Aa count

    Type the number of heterozygous individuals.

  3. 3

    Enter aa count

    Type the number of individuals with two a alleles.

  4. 4

    Compare observed and expected frequencies

    Read each genotype frequency and compare it with p², 2pq, and q² expectations.

Genotype frequency formula and Hardy-Weinberg comparison

Observed genotype frequency uses simple proportions. AA frequency equals AA/N, Aa frequency equals Aa/N, and aa frequency equals aa/N. The three values describe the current genotype distribution in your sample.

AA expected = p²

Aa expected = 2pq

aa expected = q²

For allele-copy calculations, use the Allele Frequency Calculator. If the observed and expected frequencies differ strongly, test the model with the Hardy-Weinberg Calculator.

Genotype frequency calculator worked examples

Example 1: near 1:2:1 distribution

A class counts 49 AA, 42 Aa, and 9 aa individuals. N equals 100, so observed genotype frequencies are 0.49, 0.42, and 0.09. Allele frequencies are p = 0.70 and q = 0.30, giving expected values p² = 0.49, 2pq = 0.42, and q² = 0.09.

Example 2: heterozygote deficit

A sample has 58 AA, 14 Aa, and 28 aa genotypes. Observed heterozygosity equals 14%. The allele frequencies predict 2pq near 47%, so heterozygotes appear far below expectation. Inbreeding, population mixing, or genotype calling problems could explain the gap.

Genotype frequency interpretation table

AA/N

Observed homozygous A frequency

Aa/N

Observed heterozygote frequency

aa/N

Observed homozygous a frequency

2pq

Expected heterozygote frequency under random mating

F

Heterozygote deficit or excess signal from Ho and He

Where genotype frequency calculations help

Genotype frequencies help students move from raw class counts to population-genetic reasoning. They also help researchers inspect SNP panels before formal equilibrium testing. A quick frequency view often catches swapped labels, missing genotypes, and unusual heterozygote patterns.

Breeding and conservation work often compares genotype distribution with inbreeding risk. When heterozygotes are consistently low, the Inbreeding Coefficient Calculator can help connect pedigree structure with homozygosity.

What Genotype Frequency Calculator does not infer

This calculator describes a biallelic diploid genotype distribution. It does not infer ancestry, diagnose disease risk, phase haplotypes, or correct population structure. It also does not handle multi-allelic loci, sex-linked hemizygous genotypes, or polyploid samples.

A visible gap between observed and expected genotype frequencies identifies a pattern, not the cause. Confirm the pattern with a larger sample, a formal test, and the biological context of the species, locus, and sampling design.

Genotype Frequency Calculator FAQs

What does a genotype frequency calculator measure?

A genotype frequency calculator measures the proportion of individuals in each genotype class. For a biallelic diploid locus, the classes are AA, Aa, and aa. The tool divides each genotype count by the total number of individuals. It also estimates allele frequencies and Hardy-Weinberg expected genotype frequencies from the same data.

How do you calculate genotype frequency from counts?

Divide each genotype count by the total sample size. If a sample has 49 AA, 42 Aa, and 9 aa individuals, N equals 100. The genotype frequencies are 0.49, 0.42, and 0.09. Those three frequencies should sum to 1, except for rounding in displayed percentages.

How is genotype frequency different from allele frequency?

Genotype frequency counts individuals, while allele frequency counts allele copies. AA, Aa, and aa frequencies describe the genotype distribution. p and q describe the allele pool behind that distribution. Two populations can share the same p and q values but differ in heterozygote frequency if mating is not random or if populations are mixed.

What are p squared, 2pq, and q squared?

p², 2pq, and q² are expected genotype frequencies under Hardy-Weinberg conditions for a two-allele locus. p² predicts AA frequency, 2pq predicts Aa frequency, and q² predicts aa frequency. The calculator derives p and q from the observed counts, then displays those expected values beside the observed genotype frequencies. The comparison helps users see heterozygote excess or deficit quickly.

What does a heterozygote deficit mean?

A heterozygote deficit means observed Aa frequency is lower than the expected 2pq value. It can occur through inbreeding, population subdivision, nonrandom mating, selection against heterozygotes, or genotyping problems. The calculator reports F = 1 − Ho/He as a simple signal of deficit or excess. Positive F suggests fewer heterozygotes than expected.

Can this calculator replace a Hardy-Weinberg chi-square test?

No. This calculator shows observed and expected genotype frequencies, but it does not provide a formal p-value. Use the Hardy-Weinberg Calculator when you need a chi-square test or exact test workflow. This page works best as the fast descriptive step before statistical testing.

Can I use genotype frequency for human SNP data?

Yes, if the SNP is biallelic and the genotype counts are complete. For example, C/C, C/T, and T/T counts can map to AA, Aa, and aa labels. Missing calls, uncertain genotypes, sex-linked loci, and copy-number variants require extra handling. This tool assumes diploid autosomal genotype classes.

Why does this tool calculate F from heterozygosity?

F = 1 − Ho/He gives a compact comparison between observed and expected heterozygosity. Ho equals the observed Aa frequency, and He equals 2pq. Positive values indicate a heterozygote deficit, while negative values indicate heterozygote excess. This statistic gives a quick clue, not a complete population-genetic diagnosis.

These tools help connect genotype distributions with allele frequencies, inbreeding, and population structure.