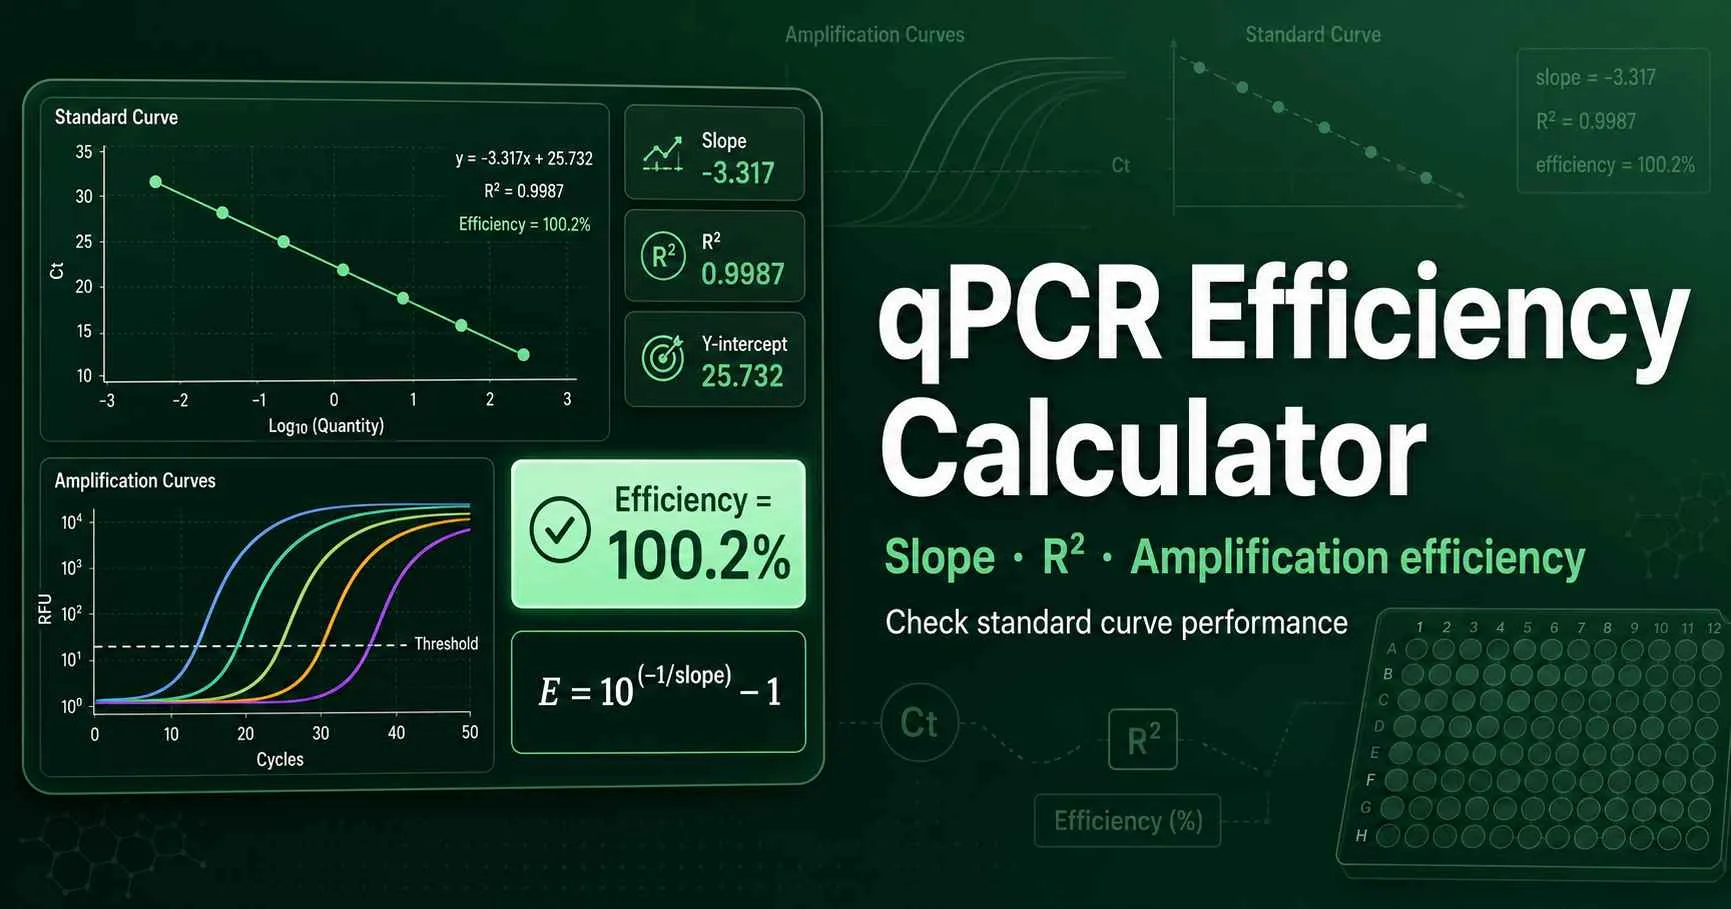
qPCR Efficiency Calculator from Slope and Standard Curve Data

Calculate qPCR amplification efficiency from a standard-curve slope or from Cq values in a dilution series. The calculator reports efficiency percentage, fold amplification per cycle, R², regression equation, and Cq spacing so you can judge assay quality before using unknown samples.

qPCR Efficiency Calculator for Basic Slope and Advanced Cq Data

Start with the slope if your instrument software already reports it. Switch to Advanced mode when you want to calculate the curve from standard quantities and Cq values yourself.

Choose qPCR efficiency calculator mode

Use Basic mode when your software already reports the standard-curve slope. Use Advanced mode when you have Cq values from a dilution series.

Basic qPCR slope input

Enter the slope from a graph where Cq sits on the y-axis and log10 template quantity sits on the x-axis.

qPCR efficiency result

The result updates instantly when you change the slope or standard-curve points.

Strong qPCR standard curve

Your slope and R² support reliable quantification across the tested dilution range.

Efficiency

100.0%

Slope

-3.322

0.9990

Fold per Cq

2.00×

A 10× dilution series should separate standards by about 3.32 Cq cycles with this slope.

qPCR efficiency calculator diagram showing a standard curve, Cq dilution points, slope, R squared, and amplification efficiency
Figure 1. A qPCR efficiency curve links template quantity, cycle threshold, primer amplification behaviour, and fluorescence detection. The slope converts into amplification efficiency, while R² shows how consistently the dilution standards follow a linear response.

qPCR Efficiency Meaning: What the Slope Tells You

qPCR efficiency tells you how much target DNA increases during each amplification cycle. A perfect 100% reaction doubles product every cycle. A slope near −3.32 fits that ideal when Cq sits on the y-axis and log10 template quantity sits on the x-axis.

The key formula is E = 10^(-1/slope) − 1. The calculator multiplies E by 100 to report percent efficiency. It also reports the amplification factor, which equals 1 + E.

Thermo Fisher describes qPCR efficiency calculators as tools that estimate reaction efficiency from the standard-curve slope. The MIQE guidelines ask researchers to report enough qPCR details for transparent interpretation, including calibration-curve information when quantification depends on it. Check the Thermo Fisher qPCR efficiency reference.

qPCR Efficiency Calculator Components and What Each Output Means

Each part of the tool answers one practical lab question. Use this table before changing inputs so you know which value controls the assay interpretation.

Basic slope input

Purpose: Converts a reported standard-curve slope into amplification efficiency.

Use: Use it when your qPCR software already fitted the standard curve.

Advanced Cq table

Purpose: Calculates slope, intercept, and R² from dilution-series data.

Use: Use it when you want to verify the regression instead of trusting exported software numbers.

Efficiency result card

Purpose: Shows the percent efficiency and average fold amplification per cycle.

Use: Use it to judge whether the assay supports absolute or relative quantification.

Cq spacing output

Purpose: Predicts how far standards should separate for your dilution factor.

Use: Use it to spot poor dilution design or unexpected curve compression.

Standard-curve chart

Purpose: Plots Cq against log10 template quantity.

Use: Use it to find outlier standards and narrow the reliable quantification range.

How to Use qPCR Efficiency Calculator Results Correctly

  1. 1

    Enter the qPCR standard-curve slope

    Use Basic mode when your qPCR software reports a slope from Cq versus log10 template quantity.

  2. 2

    Use Advanced mode for Cq dilution data

    Enter each standard quantity and its Cq value so the calculator can run the linear regression directly.

  3. 3

    Check qPCR efficiency and R squared

    Read the efficiency percentage, amplification factor, slope, and R² quality signal before accepting the assay.

  4. 4

    Compare Cq spacing across standards

    Review the predicted Cq gap for your dilution factor and inspect whether your standard points follow a straight line.

For absolute qPCR, build standards from a known template amount. The DNA Copy Number Calculator helps convert plasmid or amplicon concentration into copies before you create the dilution series.

qPCR Efficiency Interpretation Table for Slope, R², and Assay Quality

Efficiency 90–110%

Meaning: Usually acceptable for many qPCR assays

Action: Check R², melt curve, and no-template controls before reporting results.

Slope near −3.32

Meaning: The assay doubles product close to every cycle

Action: Use the assay if the standard curve stays linear across unknown samples.

R² ≥ 0.99

Meaning: Standards fit the regression line tightly

Action: Keep the same dilution range for future validation runs.

Efficiency below 90%

Meaning: Amplification lags behind ideal doubling

Action: Review primer design, amplicon length, inhibitors, Mg²⁺, and annealing temperature.

Efficiency above 110%

Meaning: The slope looks too shallow for normal doubling

Action: Check dilution accuracy, primer dimers, nonspecific products, and baseline threshold settings.

qPCR Efficiency Examples for Standard Curves and Gene Expression

Example 1: Slope −3.32 from a 10-fold dilution curve

A standard curve gives a slope of −3.32 and R² = 0.998. The calculator reports about 100% efficiency because each cycle doubles product. A 10-fold dilution should shift Cq by about 3.32 cycles.

This assay can support absolute quantification if unknown samples fall inside the tested dilution range. Prepare the reaction consistently with a PCR Master Mix Calculator so pipetting variation does not widen the curve.

Example 2: Slope −3.85 with low qPCR efficiency

A slope of −3.85 gives about 82% efficiency. Product no longer doubles cleanly each cycle. The standards may still look ordered, but low efficiency can bias copy-number estimates and relative expression values.

Review primer specificity, amplicon length, template purity, and annealing temperature. For RT-qPCR, check efficiency before using a Delta Delta Ct Calculator, especially when target and reference assays differ.

qPCR Efficiency Problems: Why Standard Curves Fail

Low efficiency often points to a real reaction problem. Primers may bind weakly, the amplicon may run too long, or the template may carry inhibitors from extraction. A concentrated first standard can also suppress amplification and bend the curve.

High efficiency often points to a measurement problem. Serial dilution error can compress Cq spacing. Primer dimers and nonspecific products can increase fluorescence before the true target dominates. A melt curve or gel check helps separate assay chemistry from data handling.

Bustin and colleagues introduced the MIQE guidelines to improve qPCR transparency and reproducibility. Use the calculator result as part of assay validation, not as a replacement for controls, melt-curve review, and appropriate standard design. Read the MIQE guideline record on PubMed.

Use these tools around the qPCR efficiency step to plan standards, prepare reactions, and interpret expression results.

qPCR Efficiency Calculator FAQs

What does a qPCR efficiency calculator measure?

A qPCR efficiency calculator measures how much product an assay creates in each PCR cycle. A 100% efficient assay doubles product every cycle, so the amplification factor equals 2.00. The calculator converts standard-curve slope into efficiency using E = 10^(-1/slope) − 1. It also checks R² and Cq spacing so you can judge the standard curve before using it for quantification.

What qPCR efficiency range should I aim for?

Many labs treat 90% to 110% efficiency as a practical screening range for qPCR assays. A 100% efficient assay gives a slope near −3.32 when Cq is plotted against log10 template quantity. Values below 90% suggest weak amplification, inhibition, poor primer binding, or long amplicons. Values above 110% often suggest dilution error, primer dimers, nonspecific products, or baseline threshold problems.

Why does a slope of −3.32 mean 100% qPCR efficiency?

A slope of about −3.32 means a 10-fold dilution changes Cq by 3.32 cycles. At perfect doubling, 2^3.32 is close to 10, so each cycle produces a two-fold increase. The formula E = 10^(-1/slope) − 1 converts that slope into a decimal efficiency. Multiplying by 100 gives percent efficiency.

What does R² mean in a qPCR standard curve?

R² measures how closely your standard points follow a straight line. A value near 1.000 means the dilution series behaves consistently across the tested range. Low R² can reflect pipetting variation, degraded standard, inhibitors, or a point outside the reliable quantification range. Strong efficiency with poor R² still needs review because unknown samples rely on the fitted curve.

Can I use this calculator for RT-qPCR gene expression?

Yes, you can use it to evaluate primer efficiency before RT-qPCR analysis. The tool does not calculate ΔCt or ΔΔCt fold change. Use it first to check whether target and reference assays amplify with comparable efficiency. Then use a dedicated Delta Delta Ct Calculator for relative expression analysis.

Should I enter copy number or concentration in Advanced mode?

You can enter copy number, dilution units, plasmid copies, or relative concentration. The regression only needs proportional template quantities because it uses log10(quantity). Use real copy numbers when you want the intercept to support absolute quantification. Use relative dilution values when you only need efficiency and linearity.

Why can qPCR efficiency appear above 100%?

Efficiency above 100% rarely means the reaction truly creates more than double the product every cycle. It often appears when the standard curve slope becomes too shallow. Common causes include inaccurate serial dilution, primer-dimer fluorescence, nonspecific amplicons, inhibition in concentrated standards, or threshold placement errors. Review melt curves, gel bands, no-template controls, and dilution accuracy before trusting the assay.