DNA Sequence Analyzer for GC Content, ORFs, and Reverse Complement

Paste a DNA sequence and get the results students and lab users need first. The analyzer reports length, base counts, GC content, AT content, reverse complement, open reading frames, codon usage, and common restriction sites.

Analyze DNA sequence properties instantly

Use Basic mode for sequence length, GC content, and reverse complement. Use Advanced mode when you need ORFs, codon usage, restriction-site checks, and downloadable reports.

Paste a DNA sequence

FASTA headers, spaces, and numbers are allowed. RNA U bases convert to T for DNA-style analysis.

Live sequence summary

75 bp · 50.7% GC

The analyzer will show base composition, reverse complement, ORFs, codons, and restriction sites.

A

20

T

17

G

21

C

17

Base composition

Adenine (A)20 · 26.7%
Thymine (T)17 · 22.7%
Guanine (G)21 · 28%
Cytosine (C)17 · 22.7%

Reverse complement and strand tools

Use these outputs for primer checks, cloning orientation, or antisense-strand interpretation.

Complement
TACCGGTAAC ATTACCCGGC GACTTTCCCA CGGGCTATCG CATTTCGAAC TTAAGCTAGG CTACTGGACT GGATT
Reverse complement
TTAGGTCAGG TCATCGGATC GAATTCAAGC TTTACGCTAT CGGGCACCCT TTCAGCGGCC CATTACAATG GCCAT

Translation preview

Select a reading frame to preview codon translation from the forward strand.

MAIVMGR*KGAR*RKA*IRSDDLT*

Open reading frame scan

Find ATG-start ORFs ending at TAA, TAG, or TGA on the selected strand set.

DNA sequence map showing ORF positions and strand orientationSequence map5′ to 3′ forward strand with longest ORFs marked below5′3′

No ORF meets the current minimum length. Lower the minimum, check the reverse complement, or confirm that your sequence contains an ATG start codon.

Quick interpretation

GC range

This GC range fits many PCR and cloning workflows.

ORF signal

No ATG-start ORF meets your current threshold.

Restriction sites

2 selected recognition sites were found.

DNA sequence analysis dashboard showing base composition, GC content, reverse complement, open reading frames, codon usage, and restriction enzyme sites
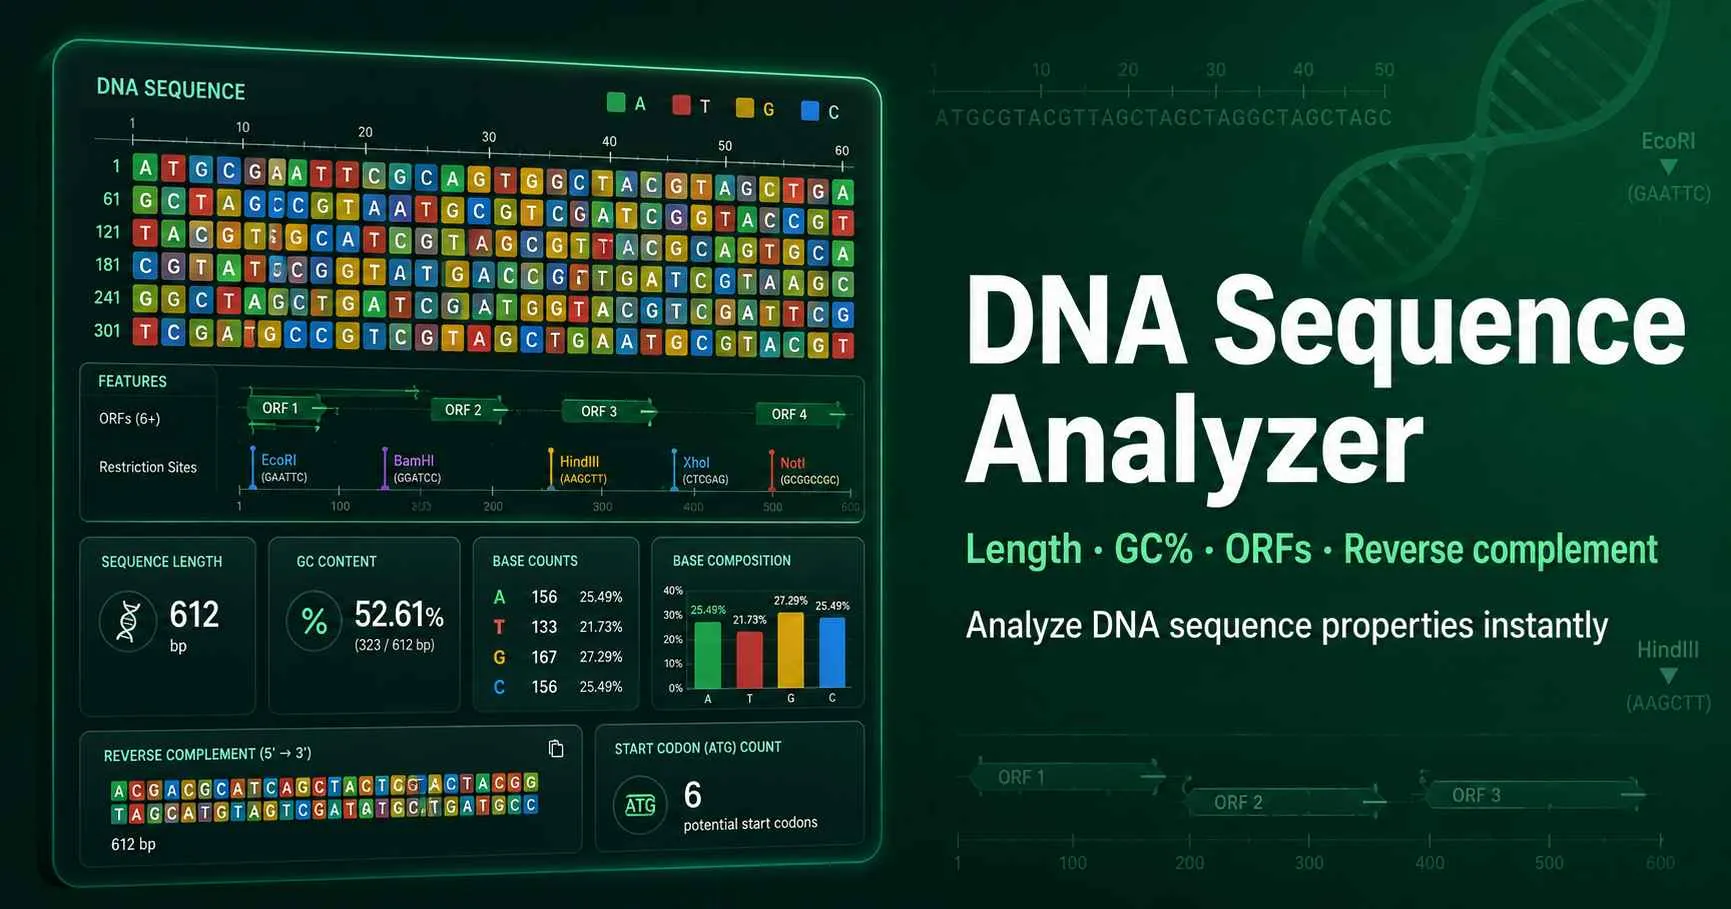
Figure 1. The DNA sequence analyzer connects primary sequence features with molecular biology decisions. It shows Watson-Crick base composition, GC-rich regions, antisense-strand orientation, ATG-start open reading frames, stop codons, and restriction enzyme recognition motifs used in cloning workflows.

What DNA sequence analysis tells you before PCR, cloning, or annotation

Sequence analysis answers a practical question first: what can this DNA fragment do? A 700 bp insert can contain a coding region, primer-binding site, restriction site, or unwanted ambiguity. You need those details before you design primers, order a synthetic fragment, plan cloning, or screen a sequencing result.

GC content gives the quickest stability clue. G-C base pairs form three hydrogen bonds, while A-T base pairs form two. High-GC regions often need stronger denaturation conditions. Low-GC regions can reduce primer melting temperature and weaken short duplexes.

Open reading frames add a second layer. A candidate ORF starts with ATG, stays in one codon frame, and ends at TAA, TAG, or TGA. NCBI ORFfinder uses the same core concept when it returns ORF ranges with protein translations from DNA input. Review NCBI ORFfinder.

DNA analyzer inputs and outputs explained

Each section answers a different laboratory question. Start with the summary, then move into ORFs or restriction sites only when the sequence passes basic checks.

Sequence input

Accepts raw DNA, FASTA text, spaces, numbers, and U bases. The tool cleans the input before analysis.

Base composition

Reports A, T, G, C, and N counts so you can spot GC bias, ambiguity, or short sequence errors.

Reverse complement

Shows the antisense strand in 5′ to 3′ format for reverse primer design and insert-orientation checks.

ORF scan

Finds ATG-start open reading frames across forward and reverse frames with user-selected minimum length.

Restriction sites

Scans common enzyme motifs such as EcoRI, BamHI, HindIII, NotI, and PstI in Advanced mode.

Report download

Exports key metrics, longest ORF, restriction hits, and reverse complement for records or lab notebooks.

Core formulas used for DNA sequence properties

These calculations stay simple because they describe sequence composition, not thermodynamic folding. Use specialized oligo tools when salt, Mg²⁺, or primer concentration matters.

GC content

GC% = (G + C) / length × 100

Use this value to judge sequence stability, primer design difficulty, and amplification conditions.

AT content

AT% = (A + T) / length × 100

AT-rich fragments often melt easily and can contain short low-complexity runs.

Reading frame

codon = bases n, n+1, n+2

A one-base shift changes every downstream codon, so ORF coordinates matter.

Practical examples for sequence review

Example 1: check a PCR amplicon before cloning

A student pastes an 84 bp PCR amplicon and finds 52.4% GC content. That value sits in a comfortable range for many cloning checks. The restriction scan shows EcoRI, BamHI, and HindIII motifs, so the student can move to a digest-planning page before choosing enzymes.

The reverse complement also confirms primer orientation. If the reverse primer sequence does not match the reverse complement, the primer may point the wrong way. This quick check prevents a failed amplification before reagents are used.

Example 2: screen a coding fragment for a likely ORF

A 900 bp insert should encode about 300 amino acids if it contains one uninterrupted coding sequence. The ORF scan finds an ATG-start ORF of 297 amino acids in frame +1 and a stop codon near the end. That pattern supports a plausible coding insert.

Short ORFs in other frames do not automatically matter. Random DNA often contains small ATG-to-stop segments. Give more weight to the longest frame, expected coding length, start context, and downstream protein evidence.

How to interpret common DNA sequence results

GC content below 35%

Expect lower duplex stability. Check primer Tm carefully and avoid very short primers.

GC content above 65%

Expect harder denaturation and possible secondary structure. Review primer design and PCR additives if amplification fails.

Many N bases

Sequence quality may limit ORF calls, codon counts, and restriction-site detection. Confirm the raw chromatogram or assembly.

No long ORF found

The fragment may be noncoding, partial, reverse-oriented, or missing a start codon. Try both strands and lower the minimum length.

Multiple enzyme hits

A diagnostic digest may produce several fragments. Use a digest predictor before ordering enzymes or interpreting gel bands.

Unexpected stop codon

A frameshift, sequencing error, pseudogene, or wrong reading frame can introduce early termination. Confirm the frame before editing constructs.

Where this sequence check fits in a molecular workflow

Run this page first when you receive a new insert, amplicon, contig, or synthetic sequence. It gives a fast overview before you open more specialized calculators. If GC content looks unusual, compare the sequence with the GC Content Calculator for focused composition work.

When an ORF appears promising, move to the DNA to Protein Translation Tool for amino-acid properties and reading-frame review. When enzyme sites matter, use the Restriction Enzyme Digest Predictor to model fragment sizes.

For oligos and primers, sequence composition alone does not tell the full story. IDT describes oligo analysis as a workflow that can include length, GC content, Tm, molecular weight, extinction coefficient, and secondary-structure checks. See IDT OligoAnalyzer.

Use these tools after the sequence overview when you need a more focused calculation.

DNA sequence analyzer FAQs

What does a DNA sequence analyzer calculate?

A DNA sequence analyzer calculates length, base composition, GC content, AT content, reverse complement, open reading frames, codon usage, and selected restriction sites. This page cleans FASTA input and accepts A, C, G, T, U, and N characters. It treats U as T because the tool focuses on DNA-style sequence analysis. Use the output before primer design, cloning, ORF screening, or sequence-quality review.

How do I find GC content from a DNA sequence?

Count guanine and cytosine bases, then divide that number by the total sequence length. The formula is GC% = (G + C) / total bases × 100. A 100 bp sequence with 28 G bases and 24 C bases has 52% GC content. GC content helps predict duplex stability, primer melting temperature, and amplification difficulty.

What is the reverse complement used for?

The reverse complement shows the sequence of the opposite DNA strand in 5′ to 3′ orientation. Primer design often needs this output because reverse primers bind the antisense strand but must be written 5′ to 3′. Cloning checks also use reverse complement logic when an insert may enter a vector in the opposite orientation. This analyzer gives both complement and reverse-complement outputs so users can compare strand direction directly.

How does the ORF scan work?

The ORF scan searches for ATG start codons and then follows the same reading frame until it reaches TAA, TAG, or TGA. It checks forward, reverse, or both strands depending on the selected setting. The result reports the strand, frame, base coordinates, nucleotide length, amino-acid length, stop codon, and protein preview. This simple method works well for teaching and first-pass screening, but final gene annotation needs database comparison and biological context.

Why does the same DNA sequence have three reading frames?

A codon uses three nucleotides, so a DNA sequence can start translation at base 1, base 2, or base 3. Those offsets create frames +1, +2, and +3 on the forward strand. The reverse complement has another three frames. A real protein-coding region usually has one dominant frame with a plausible start codon, long coding span, and sensible stop codon.

Can this tool identify genes from an unknown DNA sequence?

It can identify candidate ORFs, but it cannot prove gene identity. Gene identification usually needs BLAST, conserved-domain searches, transcript evidence, or annotation against a reference genome. NCBI ORFfinder follows the same general idea by returning ORF ranges and protein translations from DNA input. Treat this page as a fast local screening tool before deeper annotation.

Why do restriction sites matter in sequence analysis?

Restriction sites show where enzymes such as EcoRI, BamHI, HindIII, or NotI recognize a DNA sequence. Cloning workflows use these sites to cut vectors and inserts at predictable positions. Diagnostic digests also use site patterns to confirm plasmid identity or insert orientation. This analyzer scans selected enzyme motifs so users can spot useful cloning sites before moving to a full digest predictor.

What does N mean in a DNA sequence?

N marks an ambiguous nucleotide where the base call could be A, C, G, or T. Sequencing files often contain N when signal quality drops or the assembler cannot resolve a base. The analyzer counts N separately and excludes ambiguous codons from codon-usage counts. Too many N bases can hide ORFs, restriction sites, and accurate GC estimates.