Mendel's Law of Segregation Simulator

Use this Mendel's law of segregation simulator to see how alleles separate into gametes, recombine during fertilisation, and produce F1 or F2 offspring ratios. The tool helps students, teachers, and genetics learners connect meiosis with Punnett square probability.

Live Mendel's law of segregation simulator

Change parent genotypes, switch inheritance display, and move the offspring slider. The gamete diagram, Punnett square, probabilities, and simulated counts update instantly.

Choose a segregation scenario

Start with a classic monohybrid cross, then adjust the parents and sample size to see sampling variation.

F₂ segregation cross

Shows the classic 1:2:1 genotype ratio and 3:1 phenotype ratio from two heterozygous F₁ parents.

Parent 1 allele pair

Select the diploid genotype before meiosis separates the two alleles into gametes.

Parent 1: AaAaParent 1

Parent 2 allele pair

Choose the second parent, then compare the gamete contribution from each side of the cross.

Parent 2: AaAaParent 2

Live segregation result

Aa × Aa gives dominant phenotype most often

The genotype ratio is 1:2:1. The phenotype ratio is 3:1 under the selected inheritance display.

Aa gametes

50:50

Genotype

1:2:1

Sample

160

Punnett square from segregated gametes

Each row and column contains one allele after meiosis. Fertilisation restores the diploid genotype.

Gametes
A
a
A

AA

Dominant phenotype

Aa

Dominant phenotype

a

Aa

Dominant phenotype

aa

Recessive phenotype

Gamete formation diagram

Heterozygotes produce A and a gametes equally. Homozygotes produce only one allele type.

Allele segregation into gametesParent 1 gametesParent 2 gametesAaAaA50%a50%A50%a50%fertilisationone gamete from each parent

Genotype probabilities

AA25.0% · expected 40.0 · simulated 34
Aa50.0% · expected 80.0 · simulated 83
aa25.0% · expected 40.0 · simulated 43

Phenotype probabilities

Dominant phenotype75.0% · expected 120.0 · simulated 117
Recessive phenotype25.0% · expected 40.0 · simulated 43

Expected and simulated offspring counts

The expected column uses exact probability. The simulated column shows one reproducible random sample of the selected size.

GenotypePhenotypeProbabilityExpected countSimulated count
AADominant phenotype25.0%40.034
AaDominant phenotype50.0%80.083
aaRecessive phenotype25.0%40.043
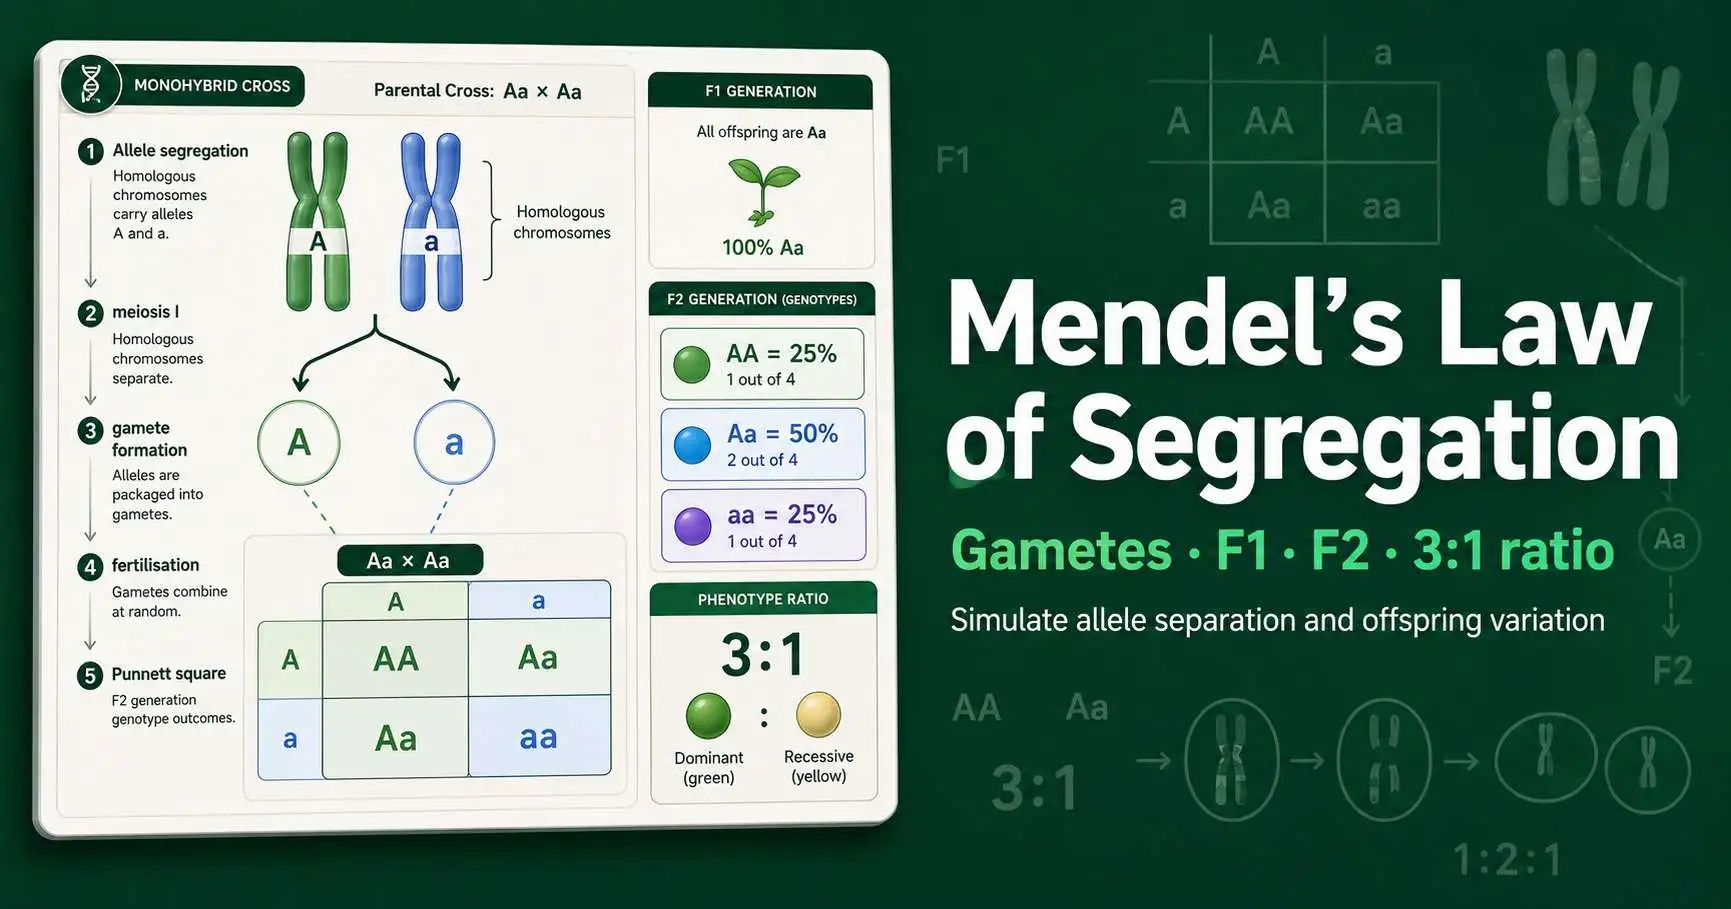
Mendel's law of segregation diagram showing homologous chromosomes separating into A and a gametes before fertilisation restores offspring genotypes
Figure 1. Homologous chromosomes carrying alleles A and a separate during meiosis I, so each gamete receives one allele. Fertilisation combines gametes again and produces AA, Aa, or aa offspring genotypes in a monohybrid cross.

What is Mendel's law of segregation?

Mendel's law of segregation states that a diploid organism carries two alleles for a gene but passes only one allele into each gamete. Gregor Mendel inferred this rule from pea plant crosses in the 1860s, before scientists knew the structure of chromosomes. His monohybrid crosses showed that recessive traits can disappear in F1 offspring and return in F2 offspring.

Meiosis explains the mechanism. Homologous chromosomes separate during meiosis I, so an Aa parent produces A-bearing and a-bearing gametes. Random fertilisation then restores two alleles in each zygote.

OpenStax describes the same physical basis: allele segregation follows chromosome separation in the first meiotic division. Read the OpenStax inheritance section.

How to use Mendel's Law of Segregation Simulator

  1. 1

    Choose a monohybrid segregation scenario

    Select Aa × Aa, AA × aa, Aa × aa, or a visible heterozygote cross from the preset buttons.

  2. 2

    Set the parent genotypes

    Pick AA, Aa, or aa for each parent to control which alleles enter the gamete pool.

  3. 3

    Adjust the simulated offspring count

    Move the sample-size slider to compare small-family variation with large-sample Mendelian expectations.

  4. 4

    Read the genotype and phenotype ratios

    Compare the Punnett square, expected probabilities, and simulated counts to see segregation in action.

What each part of Mendel's Law of Segregation Simulator does

Preset buttons

These buttons load common crosses such as Aa × Aa, AA × aa, and Aa × aa. They help you compare F1, F2, and test-cross patterns without typing values.

Parent genotype cards

Each card shows the two alleles carried by one parent. The selector controls whether that parent can make A gametes, a gametes, or both.

Inheritance display

Complete dominance groups AA and Aa into one phenotype. The visible heterozygote option keeps AA, Aa, and aa as three separate phenotype classes.

Offspring sample slider

The slider changes the number of simulated offspring. It shows why small samples drift from ratios such as 3:1, while larger samples approach expected probabilities.

Gamete diagram

The diagram turns each genotype into gametes. A heterozygote creates A and a gametes in a 50:50 split, which directly demonstrates segregation.

Probability tables

The tables compare exact expectations with simulated counts. They make the difference between a probability model and one random sample visible.

Mendelian segregation ratios for F1 and F2 crosses

A true-breeding AA × aa cross produces F1 offspring with genotype Aa. Every offspring receives A from one parent and a from the other parent. Complete dominance makes every F1individual show the dominant phenotype.

An Aa × Aa F2 cross produces a 1:2:1 genotype ratio. The four genotype boxes are AA, Aa, Aa, and aa. Complete dominance collapses AA and Aa into the same visible class, so the phenotype ratio becomes 3:1.

A test cross changes the pattern. Aa × aa produces Aa and aa offspring in a 1:1 ratio. Breeders use that logic to infer whether a dominant-looking parent carries a recessive allele.
CrossGametesGenotype ratioComplete-dominance phenotype ratio
AA × aaA only and a only0:1:01:0
Aa × AaA or a from both parents1:2:13:1
Aa × aaA or a from parent 1, a from parent 20:1:11:1

Mendel's law of segregation examples with numbers

Example 1: Aa × Aa with 160 offspring

Each parent makes A gametes 50% of the time and a gametes 50% of the time. The expected genotype counts from 160 offspring are 40 AA, 80 Aa, and 40 aa. Complete dominance predicts 120 dominant phenotype offspring and 40 recessive phenotype offspring.

Example 2: Aa × aa with 120 offspring

The heterozygous parent contributes A to half of its gametes and a to half. The recessive parent contributes only a. The expected offspring counts are 60 Aa and 60 aa, so the complete-dominance phenotype ratio equals 1:1.

Why Mendelian ratios need many offspring

A Punnett square reports probability. It does not promise that every four offspring will include exactly one AA, two Aa, and one aa. Random fertilisation can produce short runs of the same genotype, just as coin flips can produce several heads in a row.

Sample size controls how noisy the result looks. In small families, chance can hide the expected 3:1 ratio. In large seed counts, the observed proportion usually moves closer to 75% dominant and 25% recessive.

Nature Education describes Mendel's pea work as a foundation for discrete inheritance and later genetic principles. Read the Nature Education overview.

Why Mendel's segregation law matters in genetics classes and breeding

Genetics courses use segregation to connect meiosis, gametes, Punnett squares, and probability. The same idea supports test crosses in plant and animal breeding. A recessive phenotype can reveal whether a dominant-looking parent carries a hidden allele.

Segregation also prepares students for advanced topics. Linkage, epistasis, penetrance, and selection all make more sense after the basic monohybrid model feels clear. Each advanced model changes one assumption in the simple Aa × Aa cross.

What Mendel's Law of Segregation Simulator cannot infer

This simulator models one gene with two alleles. It does not estimate linkage, epistasis, environmental influence, penetrance, or polygenic inheritance. Those topics require extra genetic assumptions and different calculator logic.

The simulated counts show one reproducible random sample. Real laboratory data need careful phenotype scoring and, often, a chi-square test. Use this page for education and planning, not for medical diagnosis or formal breeding certification.

Mendel's law of segregation simulator FAQs

What does Mendel's law of segregation simulator show?
Mendel's law of segregation simulator shows how two alleles separate during gamete formation. A heterozygous Aa parent makes A and a gametes at equal frequency. Fertilisation then combines one gamete from each parent and restores the diploid genotype. In an Aa × Aa cross, that process creates a 1:2:1 genotype ratio and a 3:1 phenotype ratio under complete dominance.
Why does Aa × Aa produce a 3:1 phenotype ratio?
Each Aa parent produces two gamete types, A and a, with 50% probability each. The four fertilisation combinations are AA, Aa, Aa, and aa. Complete dominance groups AA and Aa into the same dominant phenotype class. That grouping converts the 1:2:1 genotype ratio into a 3:1 phenotype ratio.
What is the difference between F1 and F2 generations?
The F1 generation comes from crossing the original parental generation. A true-breeding AA × aa cross gives F1 offspring that all carry genotype Aa. The F2 generation often comes from selfing or intercrossing those F1 heterozygotes. An Aa × Aa F2 cross reveals recessive phenotypes again because one quarter of offspring inherit aa.
Why do small simulated offspring samples deviate from 3:1?
The 3:1 ratio describes a probability expectation, not a guarantee for every family or seed tray. A sample of 16 offspring can easily produce 11 dominant and 5 recessive offspring by chance. A sample of 1,600 usually sits much closer to 75% dominant and 25% recessive. Random fertilisation creates this sampling variation even when segregation works normally.
Can this simulator model incomplete dominance?
Yes. Switch the inheritance display to the visible heterozygote option. The simulator then treats AA, Aa, and aa as three separate phenotype classes. An Aa × Aa cross produces a 1:2:1 phenotype ratio instead of 3:1. This pattern fits traits where the heterozygote shows an intermediate or distinct phenotype.
How does allele segregation connect to meiosis?
Allele segregation occurs because homologous chromosomes separate during meiosis I. A diploid Aa cell carries one allele on each homologous chromosome. When those homologues move into different daughter cells, each gamete receives either A or a. This chromosome movement gives the Punnett square its biological basis.
Does this segregation simulator replace a chi-square test?
No. The simulator shows expected probabilities and one reproducible sample of offspring counts. A chi-square goodness-of-fit test asks whether real observed counts deviate too far from the expected ratio. Use the simulator to understand why ratios form first. Then use a Mendelian ratio chi-square calculator when you need a p-value from laboratory data.

Use these tools to move from allele segregation to Punnett square prediction and ratio testing.