Pattern preset buttons
Presets load typical clues for autosomal dominant, autosomal recessive, X-linked recessive, X-linked dominant, mitochondrial, and Y-linked inheritance. They help you learn the signature before you edit real pedigree data.
Use Pedigree Analyzer Calculator to compare inheritance patterns from family-history clues. Enter affected males, affected females, generation patterns, and transmission signs. The tool ranks autosomal dominant, autosomal recessive, X-linked recessive, X-linked dominant, mitochondrial, and Y-linked inheritance in real time.
Change any pedigree clue and the ranking updates immediately. Use the result as an evidence map, not as a clinical diagnosis.
Start with a typical pedigree, then edit the clues to match the family chart you are analysing.
Count filled male squares and filled female circles across the pedigree.
Switch on every statement that matches the pedigree. Leave uncertain clues off.
Live pedigree result
An affected person usually has an affected parent, and males and females appear at similar frequency.
Relative support
96%
Scores compare patterns against your selected pedigree clues.
New mutations, reduced penetrance, and late onset can hide a dominant pattern in a small family.
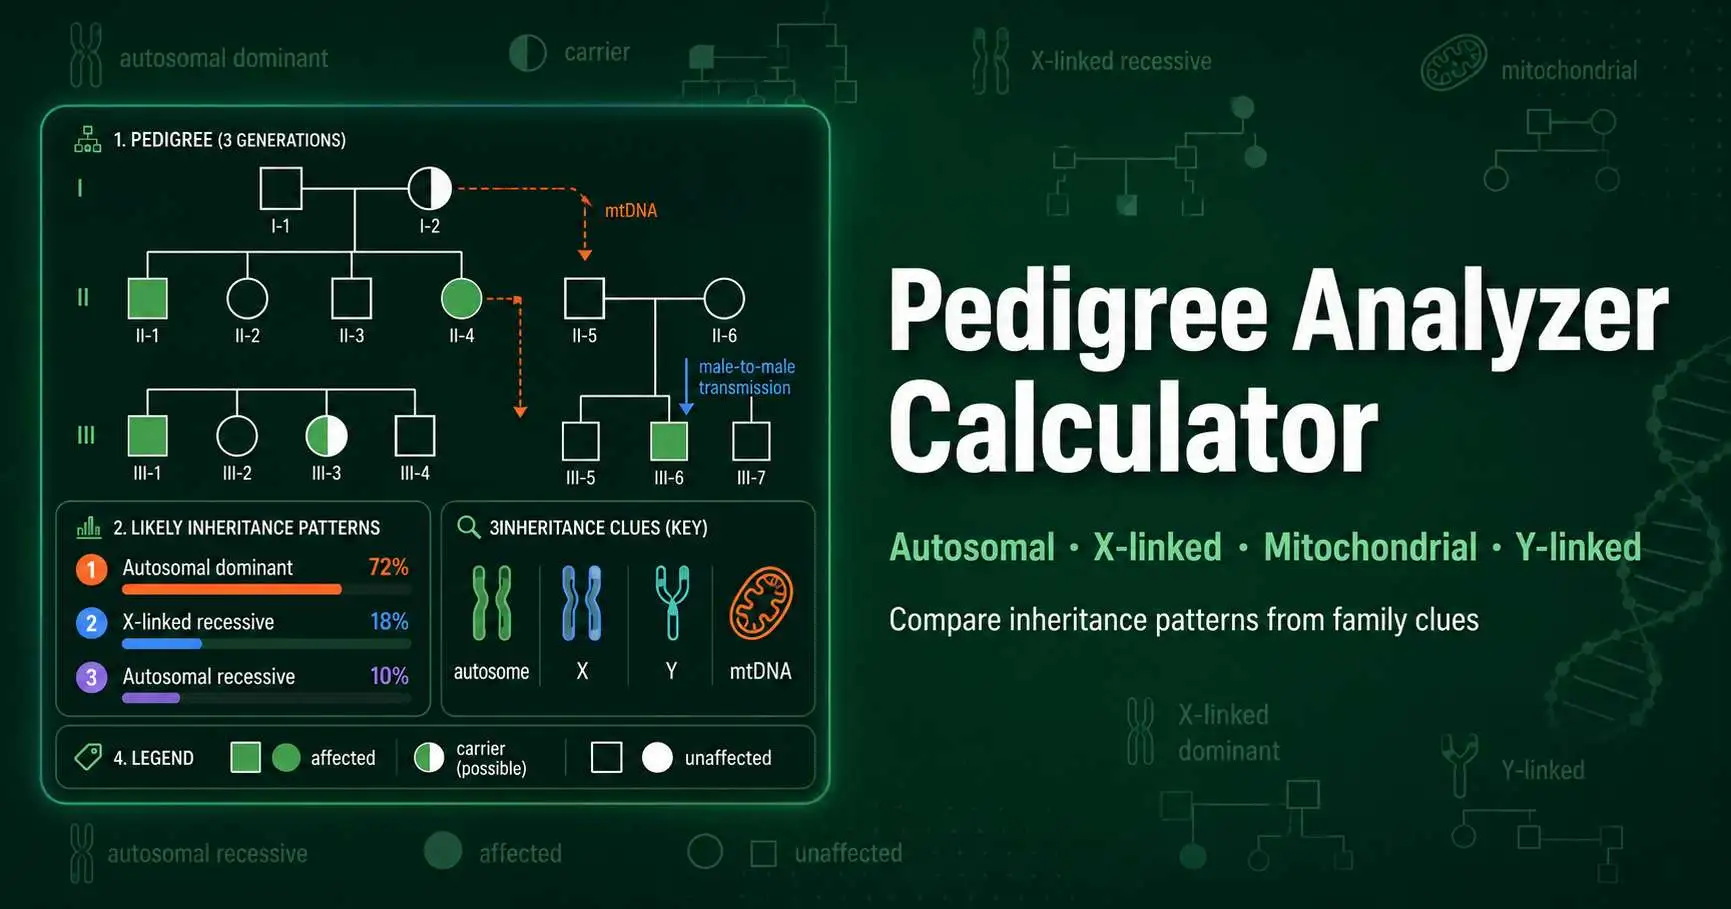
Pedigree Analyzer Calculator reads the same clues students mark on a family tree. It looks for affected sex ratio, vertical transmission, skipped generations, father-to-son transmission, and maternal transmission. Each clue adds or subtracts support for common inheritance patterns.
Pedigree symbols carry biological meaning. Squares represent males, circles represent females, filled symbols mark affected relatives, and connecting lines show parent-child relationships. OpenStax describes how autosomal, recessive, and sex-linked patterns create different family histories. Review OpenStax inheritance patterns.
A real pedigree can carry noise. Late onset, reduced penetrance, adoption, small family size, phenocopy, and de novo mutation can all distort the visible pattern. That is why the calculator ranks models rather than declaring a single final answer.
Choose a typical inheritance pattern such as autosomal dominant, autosomal recessive, X-linked recessive, mitochondrial, or Y-linked.
Count filled squares and filled circles in the family chart, then enter those numbers in the calculator.
Mark clues such as father-to-son transmission, affected mothers transmitting to all children, or unaffected parents having an affected child.
Read the top result, supporting clues, cautions, and probability bars before choosing the most likely model.
Presets load typical clues for autosomal dominant, autosomal recessive, X-linked recessive, X-linked dominant, mitochondrial, and Y-linked inheritance. They help you learn the signature before you edit real pedigree data.
These fields measure sex bias. A male-heavy pedigree can support X-linked recessive or Y-linked inheritance, while similar male and female counts often support autosomal inheritance.
Switches record the high-value features in a pedigree. Father-to-son transmission, unaffected parents with an affected child, and maternal transmission each point toward different mechanisms.
The result banner names the top model, while bars show competing explanations. The evidence panel lists the clues that pushed the top pattern upward.
Autosomal dominant inheritance usually appears in every generation. Affected fathers can pass the trait to sons because sons inherit autosomes from both parents. Autosomal recessive inheritance can appear suddenly among siblings when two unaffected carriers have children.
X-linked patterns depend on which parent passes the X chromosome. A father gives his X chromosome to daughters and his Y chromosome to sons. That rule explains why father-to-son transmission conflicts with X-linked recessive and X-linked dominant models.
Mitochondrial inheritance follows maternal cytoplasm rather than nuclear chromosomes. MedlinePlus explains that mitochondrial inheritance applies to genes in mitochondrial DNA, and that only females pass mitochondrial variants to children. Read MedlinePlus inheritance patterns.
| Pattern | Strong clue | Clue that argues against it |
|---|---|---|
| Autosomal dominant | Affected people in every generation | Unaffected parents with multiple affected children |
| Autosomal recessive | Unaffected parents have an affected child | Clear affected parent in every generation |
| X-linked recessive | Mostly affected males and no father-to-son transmission | Affected father passes trait to son |
| X-linked dominant | Affected father passes trait to all daughters | Affected father passes trait to sons |
| Mitochondrial | Affected mother transmits to children of both sexes | Affected father transmits to children |
| Y-linked | Only males affected with father-to-son transmission | Any affected female |
A pedigree shows an affected grandfather, affected father, and affected son. Females also appear affected in other branches. Father-to-son transmission rules against simple X-linked inheritance because a father gives a Y chromosome to his son.
The calculator usually ranks autosomal dominant highest when the trait appears in every generation and affects both sexes. Autosomal recessive falls lower because unaffected parents do not explain the main pattern.
Two unaffected parents have two affected sons and no affected daughters. The trait skips a generation. No father-to-son transmission appears in the chart.
The calculator often ranks X-linked recessive and autosomal recessive near the top. X-linked recessive rises when affected males dominate, while autosomal recessive rises when unaffected carrier parents can explain affected children.
A small pedigree can make one pattern look stronger than it really is. One affected son in a family with no daughters cannot prove X-linked recessive inheritance. One missing affected parent cannot disprove autosomal dominant inheritance if the trait has late onset.
Penetrance, expressivity, phenocopy, mosaicism, de novo mutation, and non-paternity can change the visible chart. Mitochondrial heteroplasmy can also change severity within one maternal line. Use the ranking to decide which model deserves closer review.
This tool supports education and preliminary interpretation. It does not replace clinical genetic counselling, diagnostic testing, or medical pedigree review.
Use these tools after a pedigree ranking to model carrier risk or sex-linked offspring probabilities.