Sequence input
This box accepts the 5′→3′ DNA oligo. It removes spaces and reports ignored characters, so pasted FASTA-style text does not silently change the calculation.
Calculate DNA oligonucleotide melting temperature from sequence and reaction conditions. The calculator estimates nearest-neighbor Tm, Wallace-rule Tm, GC content, effective salt strength, and a practical PCR annealing range. It helps students, teachers, and lab users see why the same primer sequence behaves differently in different buffers.
Enter a DNA sequence and adjust salt, magnesium, primer concentration, and DMSO. Results update on every change, so you can compare PCR conditions without pressing a calculate button.
Start with a PCR-style primer, GC-rich primer, AT-rich primer, or qPCR primer profile.
Enter a single DNA oligonucleotide in 5′→3′ orientation. Spaces and line breaks are ignored.
Salt, magnesium, primer concentration, and DMSO all change duplex stability.
Effective salt estimate
197.0 mM
Mg²⁺ contributes to an approximate monovalent-equivalent salt correction.
Live nearest-neighbor result
This Tm uses nearest-neighbor enthalpy and entropy, salt correction, oligo concentration, and DMSO adjustment.
Design status
Primer-like range
Nearest-neighbor Tm
55.3°C
Wallace rule Tm
58.0°C
GC content
45.0%
Length
20 nt
Start gradient PCR around 50.3–52.3°C, then tune using product specificity and yield.
Reverse complement
CTTGGCGTAATCATGGTCAT
Molecular weight
6110.1 g/mol
Longest base run
2 bases
Oligo concentration
2.50 × 10^-7 M
Each adjacent dinucleotide contributes enthalpy and entropy to duplex stability.
| Stack | ΔH kcal/mol | ΔS cal/(K·mol) |
|---|---|---|
| AT | -7.2 | -20.4 |
| TG | -8.5 | -22.7 |
| GA | -8.2 | -22.2 |
| AC | -8.4 | -22.4 |
| CC | -8.0 | -19.9 |
| CA | -8.5 | -22.7 |
| AT | -7.2 | -20.4 |
| TG | -8.5 | -22.7 |
| GA | -8.2 | -22.2 |
| AT | -7.2 | -20.4 |
| TT | -7.9 | -22.2 |
| TA | -7.2 | -21.3 |
| AC | -8.4 | -22.4 |
| CG | -10.6 | -27.2 |
| GC | -9.8 | -24.4 |
| CC | -8.0 | -19.9 |
| CA | -8.5 | -22.7 |
| AA | -7.9 | -22.2 |
| AG | -7.8 | -21.0 |
| Total with initiation | -155.8 | -425.0 |
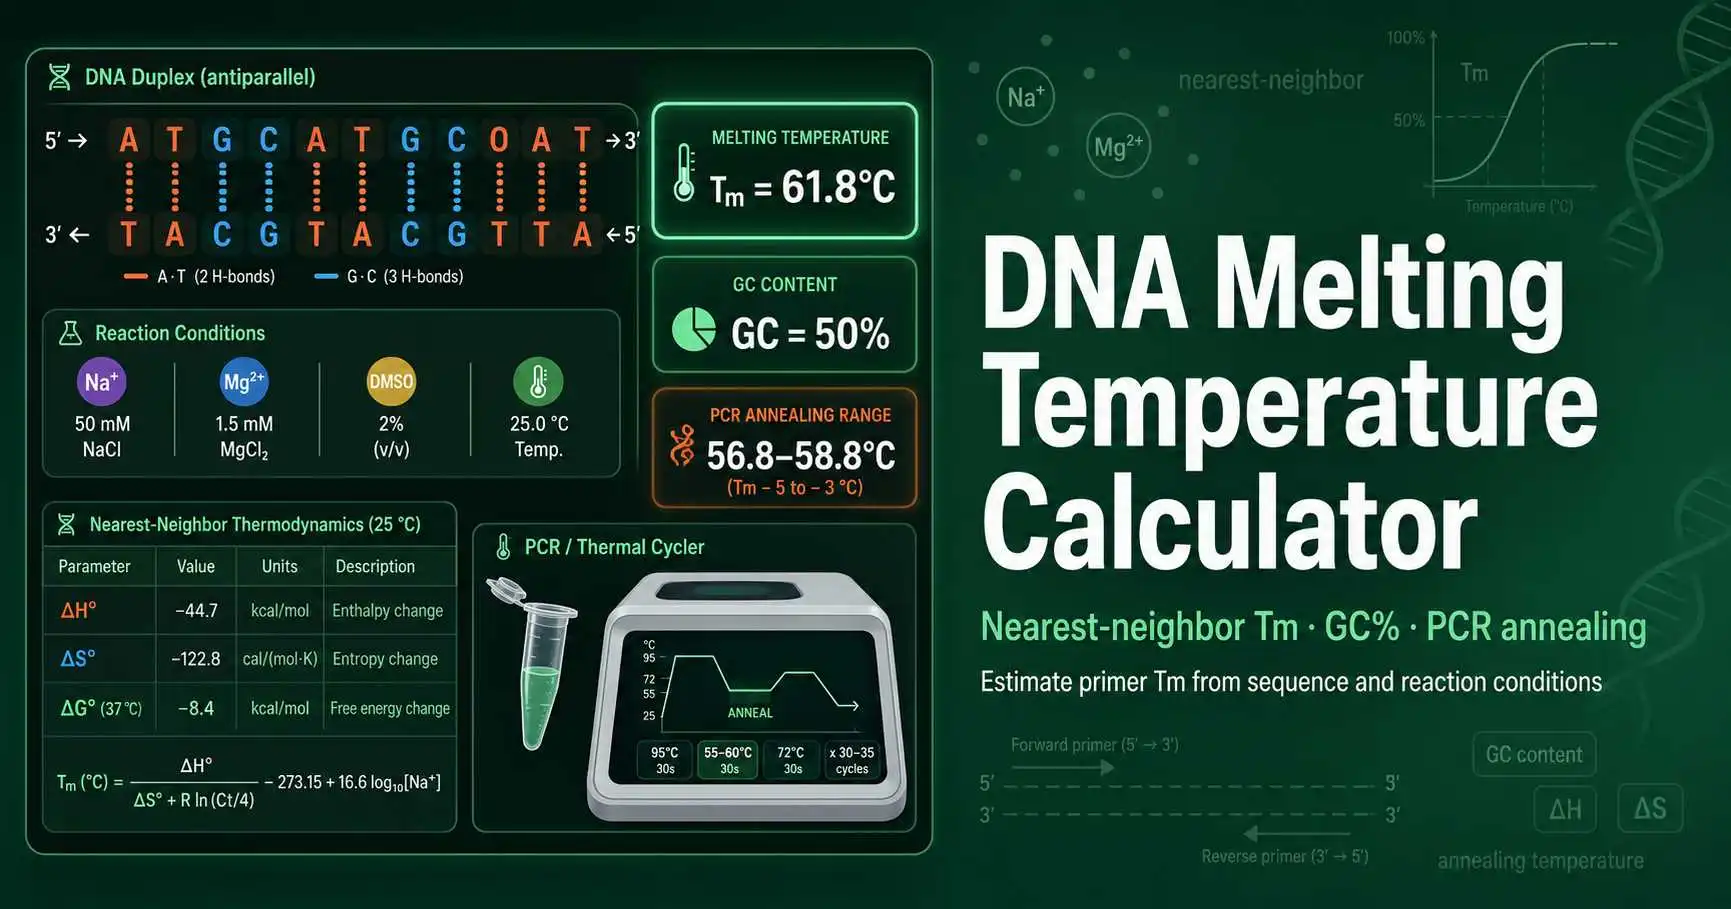
DNA melting temperature, or Tm, marks the point where half of a perfectly matched oligo duplex remains annealed. A primer does not have one universal Tm because salt, Mg²⁺, concentration, and additives change duplex stability. PCR design uses Tm as a starting point for choosing annealing temperature, not as a final guarantee of specificity.
Nearest-neighbor models improved primer Tm prediction by treating each adjacent base-pair stack as a thermodynamic unit. SantaLucia’s 1998 PNAS paper unified DNA nearest-neighbor enthalpy and entropy parameters across multiple experimental datasets. Read the SantaLucia nearest-neighbor paper.
The non-obvious part is sequence order. A 20-mer with 50% GC can melt differently from another 20-mer with the same GC percentage because GC, CG, AT, and TA stacks contribute different ΔH and ΔS values.
Paste one DNA sequence in 5′ to 3′ orientation using A, C, G, and T bases.
Add monovalent salt and magnesium concentrations in millimolar so the Tm reflects your buffer.
Enter primer concentration in nanomolar and DMSO percentage when your PCR mix uses an additive.
Use the calculated Tm, GC content, and annealing range to plan PCR optimization.
Use the same buffer assumptions for both primers in a pair. A primer pair with close Tm values usually gives a cleaner starting point than one high-Tm primer and one low-Tm primer.
This box accepts the 5′→3′ DNA oligo. It removes spaces and reports ignored characters, so pasted FASTA-style text does not silently change the calculation.
Salt, Mg²⁺, oligo concentration, and DMSO define the chemical environment. These values explain why one primer can show different Tm values across PCR master mixes.
The result cards show nearest-neighbor Tm, Wallace Tm, GC percentage, and sequence length. That comparison helps you decide whether a quick rule is enough or a thermodynamic model matters.
The notes flag short primers, high GC content, low Tm, long base runs, and unusually high Tm. These warnings target common reasons PCR primers fail.
The calculator sums ΔH and ΔS across adjacent DNA stacks, then applies oligo concentration and salt correction. In practical terms, GC-rich stacks make the duplex more stable, while low salt and DMSO reduce the predicted melting temperature. IDT states that its oligo Tm calculations use SantaLucia nearest-neighbor values, which matches the core model used here. See the IDT nearest-neighbor note.
The sequence ATGACCATGATTACGCCAAG contains 20 bases and 45% GC. Under 50 mM Na⁺, 1.5 mM Mg²⁺, and 250 nM oligo, the nearest-neighbor estimate sits near a standard PCR primer range.
A gradient PCR could start about 3 to 5°C below the reported Tm. The exact final annealing temperature should favour a single clean amplicon over maximum yield.
The sequence GCGTCCGACGGCATCGTGAC contains 70% GC. It forms stronger stacks and often gives a higher Tm than a balanced primer of the same length.
Additives such as 3% DMSO can lower the effective Tm by a few degrees. That change can help reduce secondary structure in GC-rich PCR targets.
PCR annealing temperature usually starts below the lower primer Tm in a primer pair. The polymerase buffer, template complexity, primer concentration, and Mg²⁺ level then decide whether that first estimate produces one clean band. A gradient PCR tests that range directly.
Primer pairs need compatible Tm values. If one primer melts at 62°C and the other melts at 52°C, the low-Tm primer may bind nonspecifically at the temperature needed for the high-Tm primer. Redesign often saves more time than forcing a weak pair through many cycling conditions.
qPCR assays add another demand: efficiency. Primers with balanced GC content, low self-complementarity, and similar Tm values usually support cleaner amplification curves than primers with long G/C runs or strong hairpins.
A calculated Tm cannot see every real assay feature. Template secondary structure, mismatches, primer dimers, probe labels, polymerase chemistry, and cycling speed can shift performance. Use the number as a design guide, then test the assay.
The magnesium correction in this calculator uses a practical effective-salt approximation. A full model would need free Mg²⁺ after dNTP binding and buffer interactions. That level of detail belongs in assay validation, not in a general education calculator.
This tool supports learning and primer planning. It does not validate diagnostic primers, clinical assays, forensic tests, or regulated laboratory protocols.
A DNA melting temperature calculator estimates the temperature where half of an oligonucleotide duplex remains annealed to its exact complement. The value depends on sequence, length, GC content, salt concentration, magnesium concentration, and oligo concentration. A primer with higher GC content usually melts at a higher temperature because G·C pairs use three hydrogen-bond positions and stronger stacking interactions. PCR users often start annealing temperature a few degrees below the calculated Tm.
The Wallace rule counts A/T bases as 2°C and G/C bases as 4°C, so it ignores base order. Nearest-neighbor analysis treats each adjacent base stack, such as GC or TA, as a thermodynamic unit with its own enthalpy and entropy. Two primers with the same GC percentage can therefore have different Tm values. This difference matters most for primers near the edge of acceptable PCR design ranges.
Many PCR primers work well with Tm values between about 55°C and 68°C. Primer pairs usually perform best when their Tm values differ by less than 2 to 3°C. A primer below 50°C may bind weakly or nonspecifically. A primer above 72°C can work, but GC-rich targets may need additives, longer denaturation, or a dedicated optimization step.
Salt raises DNA Tm because positive ions shield the negative charges along the phosphate backbone. More charge shielding helps complementary strands stay annealed. This calculator uses sodium plus an approximate magnesium contribution to estimate effective ionic strength. Low-salt reactions lower duplex stability, while higher-salt reactions usually increase calculated Tm.
DMSO weakens DNA duplex stability by disrupting base pairing and secondary structure. Many PCR protocols subtract about 0.6 to 0.75°C from Tm for each 1% DMSO. This calculator uses 0.75°C per percent as a practical correction. GC-rich templates often use DMSO because lower duplex stability can reduce hairpins and difficult secondary structures.
You can enter longer DNA sequences, but primer-style nearest-neighbor estimates work best for short oligonucleotides. Hydrolysis probes, molecular beacons, and long genomic fragments may need assay-specific models. Secondary structure, mismatches, fluorophores, quenchers, and locked nucleic acids can shift the real melting temperature. Use experimental melting curves when probe performance controls a diagnostic assay.
A common first PCR test uses an annealing temperature about 3 to 5°C below the lower primer Tm. This calculator reports that starting range for the sequence you enter. Gradient PCR gives better evidence because polymerase, template complexity, primer concentration, and Mg²⁺ concentration all change specificity. Choose the highest annealing temperature that still gives a strong, single product.
Magnesium usually increases duplex stability because Mg²⁺ screens phosphate backbone charge more strongly than Na⁺. PCR mixtures also contain dNTPs, and dNTPs bind magnesium, so free Mg²⁺ can differ from the number written in a protocol. This calculator uses a simplified effective-salt estimate rather than a full magnesium-binding model. For difficult assays, compare several Mg²⁺ levels experimentally.
Use these tools with the Tm calculator when you design primers, resuspend oligos, or prepare PCR reactions.