Preset buttons
These buttons load common classroom crosses. They help you compare 3:1, 1:2:1, codominant, and dihybrid outcomes without typing each example.
Calculate the probability of a specific offspring phenotype from parent genotypes. The tool supports complete dominance, recessive traits, incomplete dominance, codominance, and custom targets such as A_B_, A_bb, aa, and Aa.
Enter parent genotypes, choose the inheritance rule, and define the phenotype you want. The result updates instantly as a percentage, fraction, distribution chart, and Punnett grid.
Start with a textbook cross, then edit the genotypes and target phenotype pattern.
Type one, two, or three loci. Use paired alleles such as Aa, AaBb, or AaBbCc.
Choose how genotypes map to phenotypes, then enter the phenotype you want to calculate.
Pattern guide
Use A_ for at least one dominant allele, aa for homozygous recessive, and Aa for an exact heterozygote.
Live phenotype result
This equals 9/16 of the possible offspring outcomes under the selected inheritance rule.
Target chance
56.25%
Each bar shows the chance of a phenotype class after combining all gamete outcomes.
Parent 1 gametes
Parent 2 gametes
Cross: AaBb × AaBb
Rule: complete
Matching outcomes: 9 of 16 Punnett cells before probability weighting.
Most common class: A_B_ at 56.25%
Highlighted cells match your target pattern. Each cell shows genotype and phenotype class.
AABB
A_B_
AABb
A_B_
AaBB
A_B_
AaBb
A_B_
AABb
A_B_
AAbb
A_bb
AaBb
A_B_
Aabb
A_bb
AaBB
A_B_
AaBb
A_B_
aaBB
aaB_
aaBb
aaB_
AaBb
A_B_
Aabb
A_bb
aaBb
aaB_
aabb
aabb
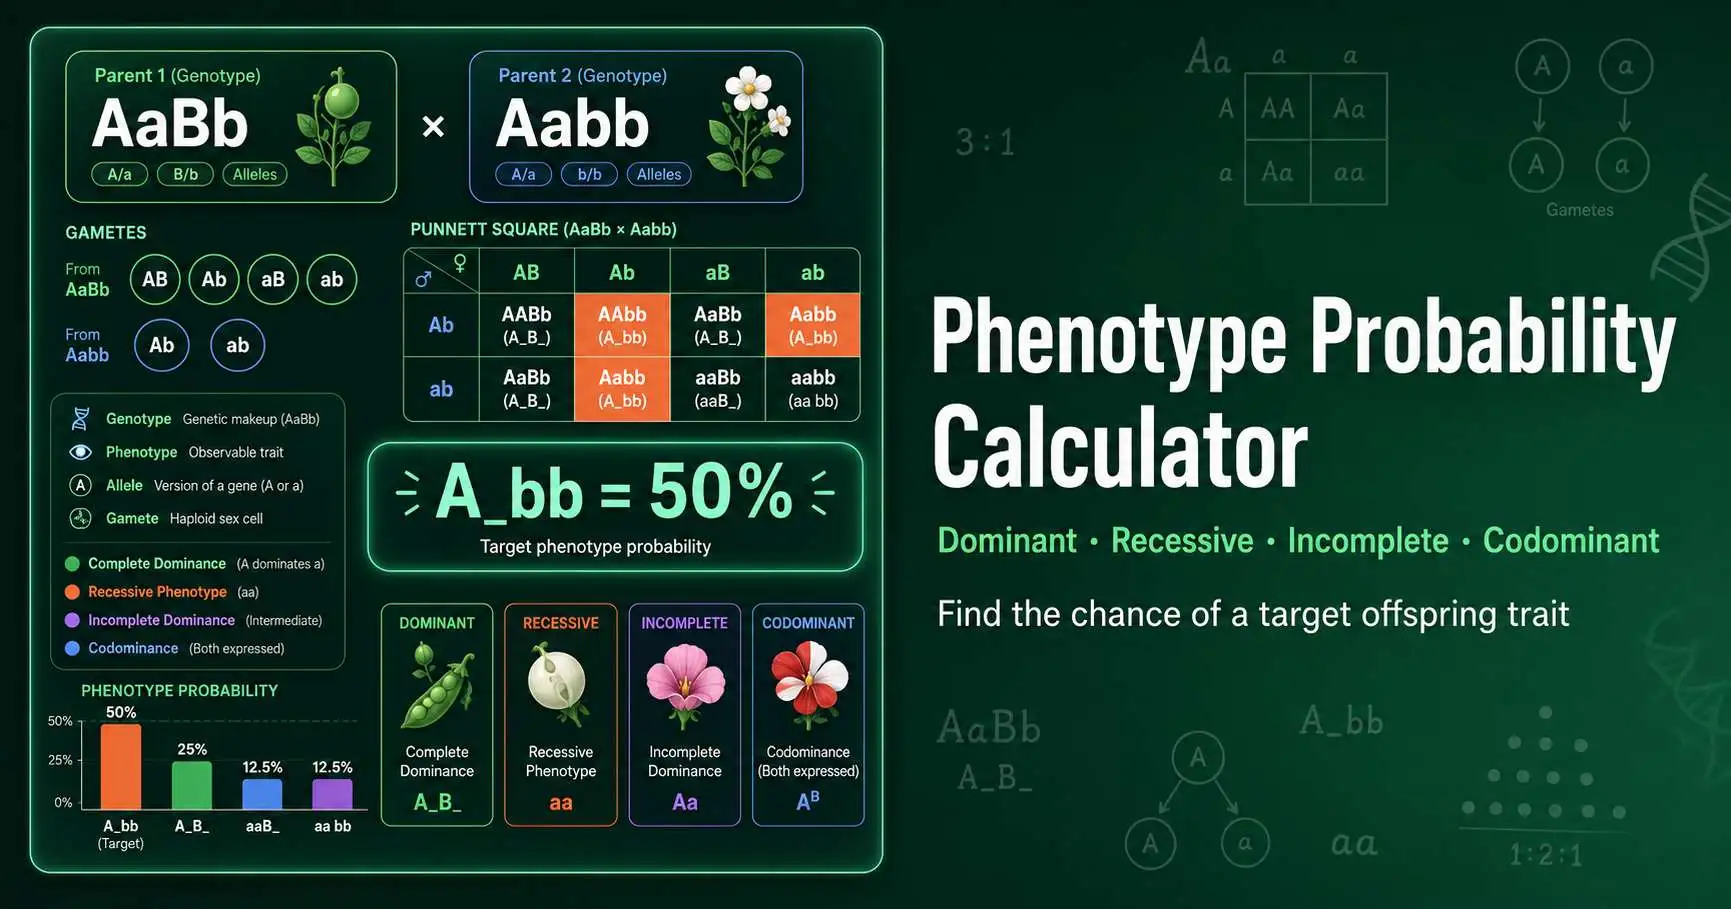
A student often knows the parent genotypes but needs one specific outcome. For example, AaBb × AaBb can produce A_B_, A_bb, aaB_, and aabb phenotypes. This calculator answers the direct question: what is the chance of the phenotype I want?
The tool separates genotype from phenotype. That distinction matters because AA and Aa can show the same dominant phenotype, while Aa forms a separate class in incomplete dominance and codominance. OpenStax describes how Mendel's dominance rule works and why other inheritance patterns extend that rule. Read the OpenStax inheritance overview.
You can use the calculator for single-locus crosses, dihybrid crosses, and three-locus practice questions. It works best when each gene uses two alleles and the genes assort independently.
Type each parent genotype using paired alleles, such as Aa, AaBb, or Aabb.
Select complete dominance, incomplete dominance, codominance, or custom target pattern logic.
Use patterns such as A_, aa, A_B_, A_bb, or Aa to define the offspring class you want.
Review the percentage, fraction, gamete list, phenotype distribution, and highlighted Punnett grid cells.
Use capital letters for dominant alleles and lowercase letters for recessive alleles. Keep the same gene order in both parents. Write AaBb × Aabb, not AaBb × BbAa.
These buttons load common classroom crosses. They help you compare 3:1, 1:2:1, codominant, and dihybrid outcomes without typing each example.
Each card stores one parent's alleles. The calculator converts those alleles into gametes before it builds offspring combinations.
This control tells the calculator how genotype becomes phenotype. Complete dominance combines AA and Aa, while incomplete dominance and codominance keep Aa separate.
This field defines the offspring class you want. A_B_ means at least one dominant allele at both loci, while aa means homozygous recessive at one locus.
The banner gives the direct answer. The bars show all phenotype classes. The grid lets you see which gamete combinations match the target and which combinations produce other outcomes.
Complete dominance maps AA and Aa to the same dominant phenotype. Recessive phenotypes need aa, because one dominant allele masks the recessive allele in the heterozygote.
Incomplete dominance gives the heterozygote an intermediate phenotype. Aa × Aa therefore gives 25% homozygous dominant, 50% intermediate, and 25% homozygous recessive offspring. Nature Education explains this genotype-phenotype relationship and contrasts incomplete dominance with codominance. Review the Nature Education dominance article.
Codominance lets both alleles express in the heterozygote. A codominant Aa offspring does not look like AA or aa. The calculator treats that heterozygote as its own phenotype class.
Two carriers produce four genotype outcomes: AA, Aa, Aa, and aa. Only aa shows the recessive phenotype under complete dominance. The phenotype probability equals 1/4, or 25%.
The target A_bb needs at least one dominant A allele and two recessive b alleles. Parent 1 makes AB, Ab, aB, and ab gametes. Parent 2 makes Ab and ab gametes. Four of eight weighted outcomes match A_bb, so the probability equals 50%.
Genotype probability asks which allele pair an offspring inherits. Phenotype probability asks what trait class that genotype produces. A single phenotype can contain several genotypes.
Aa × Aa shows the difference clearly. The genotype ratio is 1 AA : 2 Aa : 1 aa. Under complete dominance, AA and Aa share the dominant phenotype, so the phenotype ratio becomes 3 dominant : 1 recessive.
Dihybrid crosses expand the same idea. A_B_ includes AABB, AABb, AaBB, and AaBb genotypes. That is why a phenotype class can be common even when any single genotype inside it has a smaller probability.
This calculator assumes independent assortment unless you enter a single-locus cross. Linked genes can change gamete frequencies and shift phenotype probabilities away from simple Punnett square expectations.
Real traits can also involve penetrance, expressivity, environment, epistasis, or many genes of small effect. Human eye colour, height, and skin pigmentation do not follow a single Aa pattern.
Use this page for learning, homework checking, and planning simple genetic crosses. Do not use it as a clinical genetic risk assessment or diagnostic tool.
Use these tools when you need the full cross table or want to compare observed offspring counts with an expected ratio.
Calculate exact genotype and phenotype ratios for two-locus crosses such as AaBb × AaBb.
Open CalculatorCompare observed offspring counts with expected ratios such as 3:1, 1:2:1, and 9:3:3:1.
Open Calculator