Preset buttons
Presets load realistic classroom data for clean 1:1 results, all-dominant offspring, distorted monohybrid counts, and dihybrid linkage patterns. They help students compare common outcomes before entering their own counts.
Use offspring counts from a test cross to infer whether a dominant-looking parent carries a hidden recessive allele. The calculator handles monohybrid A_ × aa crosses, dihybrid AaBb × aabb crosses, chi-square testing, and linkage clues from recombinant classes.
Load a preset, enter observed offspring counts, and see the genotype inference update instantly.
Load a preset, then edit the trait labels and offspring counts. Results update as you type.
Describe the dominant-looking parent and choose whether the test cross has one or two loci.
Enter counted offspring classes from the cross with a homozygous recessive tester.
Live inference
Recessive offspring appeared, so the unknown parent carries a recessive allele. The counts fit the expected 1:1 test-cross ratio at α = 0.05.
χ²
0.040
df
1
p-value
0.841
| Class | Observed | Expected if Aa | Ratio |
|---|---|---|---|
| Round seeds | 51 | 50 | 1 |
| Wrinkled seeds | 49 | 50 | 1 |
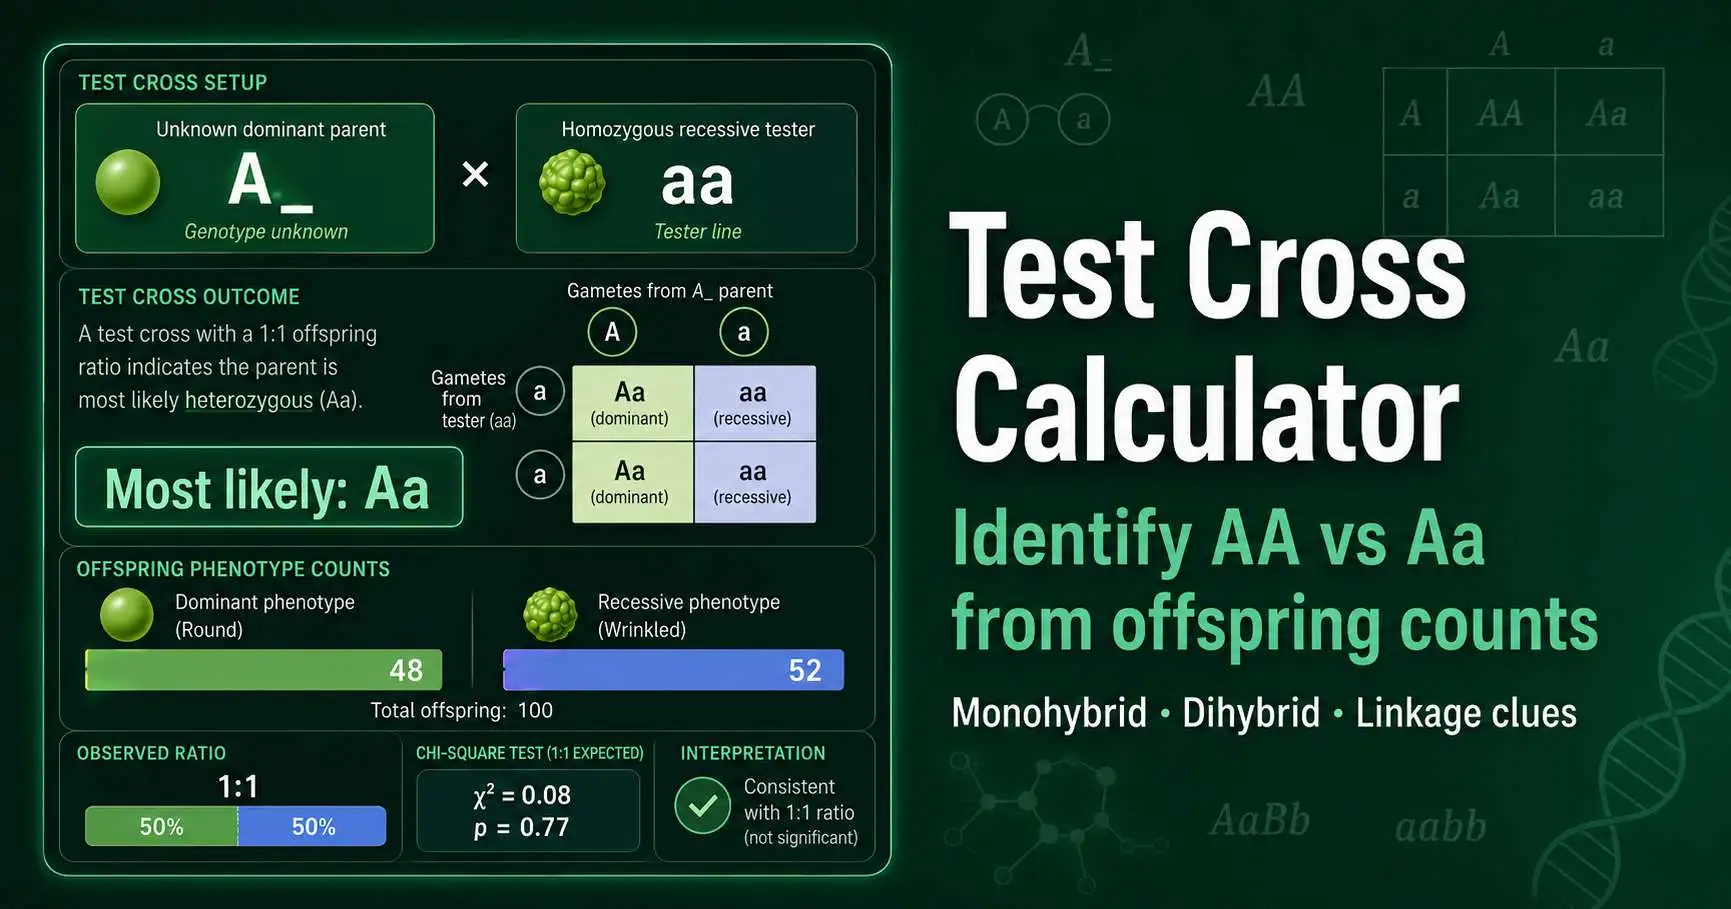
A test cross identifies an unknown genotype by crossing a dominant-looking organism with a homozygous recessive tester. Gregor Mendel used true-breeding pea lines in the 1860s, and later geneticists turned his segregation logic into a standard experimental design. OpenStax describes how a test cross distinguishes homozygous dominant and heterozygous parents in classical inheritance. Read the OpenStax test-cross explanation.
For one locus, the unknown parent has genotype A_ because it shows the dominant phenotype. The tester has genotype aa. Recessive offspring can only appear when the unknown parent contributes the a allele, so any aa offspring reveal heterozygosity.
Dihybrid test crosses extend the same logic to two loci. An AaBb parent crossed with aabb produces offspring that directly reflect AB, Ab, aB, and ab gametes. Independent assortment predicts a 1:1:1:1 ratio, while linkage enriches parental gamete classes.
Select monohybrid for A_ × aa data or dihybrid for AaBb × aabb data with four phenotype classes.
Type clear phenotype names such as round seeds, wrinkled seeds, A_B_, A_bb, aaB_, and aabb.
Use raw counts from the test cross rather than percentages because chi-square calculations require counts.
Use the result banner, p-value, and ratio table to decide whether the unknown parent fits AA, Aa, or a dihybrid model.
Write genotypes with uppercase dominant alleles and lowercase recessive alleles. Use A_ when a parent shows a dominant phenotype but could be AA or Aa.
Presets load realistic classroom data for clean 1:1 results, all-dominant offspring, distorted monohybrid counts, and dihybrid linkage patterns. They help students compare common outcomes before entering their own counts.
This card defines the genetic question. Monohybrid mode asks whether A_ means AA or Aa. Dihybrid mode asks whether an AaBb parent produces four gamete classes equally or shows linkage.
This section holds the observed progeny data. The recessive tester contributes only recessive alleles, so each offspring phenotype exposes the allele or gamete contributed by the unknown parent.
The banner gives the main inference first. The tables show expected counts, χ², degrees of freedom, p-value, and recombinant fraction so students can defend the conclusion in lab reports.
A round-seeded pea plant gets crossed to a wrinkled tester. The offspring include 51 round and 49 wrinkled seeds. A 1:1 ratio predicts 50 round and 50 wrinkled offspring.
χ² = 0.04 with 1 degree of freedom. The p-value is about 0.84, so the data fit Aa × aa. The unknown parent most likely carries one dominant allele and one recessive allele.
A purple-flowered plant gets crossed to a white-flowered tester. All 20 offspring show purple flowers. If the unknown parent were Aa, the chance of missing every white offspring equals (1/2)20.
That probability is about 0.000095%. The result strongly supports AA under complete dominance. A smaller sample, such as 3 or 4 offspring, would give weaker evidence.
Test crosses turn hidden genotype differences into countable phenotypes. Plant breeders use that logic when they need to confirm whether a selected dominant plant still carries an unwanted recessive allele. Genetics students use the same design to connect meiosis, segregation, fertilisation, and probability.
Molecular genetics later connected several Mendelian pea phenotypes with specific genes. Bhattacharyya, Smith, Ellis, Hedley, and Martin showed in 1990 that wrinkled pea seeds trace to an insertion in a gene encoding starch-branching enzyme. That work linked a classical phenotype to starch synthesis inside developing seeds. View the PubMed record.
Dihybrid test crosses add another layer. When four offspring classes deviate from 1:1:1:1, geneticists can inspect parental and recombinant classes. OpenStax covers the independent assortment principle that produces equal gamete classes when loci assort independently. Review independent assortment.
The calculator assumes complete dominance, accurate phenotype scoring, and viable offspring classes. Incomplete dominance, codominance, penetrance, epistasis, and lethal alleles can change the expected ratios. Use the result as a model check, not as proof that every biological assumption holds.
Chi-square tests also need adequate expected counts. Many instructors avoid interpreting a class with an expected value below 5. A larger offspring sample gives stronger evidence, especially when no recessive progeny appear.
This tool supports education and basic genetics planning. It does not provide medical diagnosis, clinical carrier-risk counselling, or professional breeding certification.
Use these tools to build expected ratios first, then test whether real offspring counts match the model.
Test observed offspring counts against expected Mendelian ratios such as 3:1 and 9:3:3:1.
Open CalculatorCalculate genotype and phenotype probabilities for two-locus crosses such as AaBb × AaBb.
Open Calculator